ICP-OES – ICP Chemistry, ICP-OES Analysis, Strengths and Limitations


Complete the form below to unlock access to ALL audio articles.
Contents
ICP-OES vs ICP-AES – Is there a difference?
How do you analyze ICP-OES data and what does it tell you?
What is ICP-OES?
Inductively coupled plasma-optical emission spectroscopy (ICP-OES) is an analytical technique that is used to identify the atomic composition of a particular sample. The technique makes use of the unique photophysical signals of each element to successfully detect the type and relative amount of each element within the complexity of a compound. ICP-OES has particular utility in the analysis of complex samples,1 and has been used in applications such as analyzing trace elements in the human brain,2 determining the chemical composition of electronic cigarettes,3 pesticide screening and assessing the purity of pharmaceutical compounds.4 The technique has also found routine utility in the analysis of drinking water, wine and petrochemicals where it has roles throughout the discovery, extraction and purification process.How does ICP-OES work?
To perform ICP-OES, one needs the following key components:
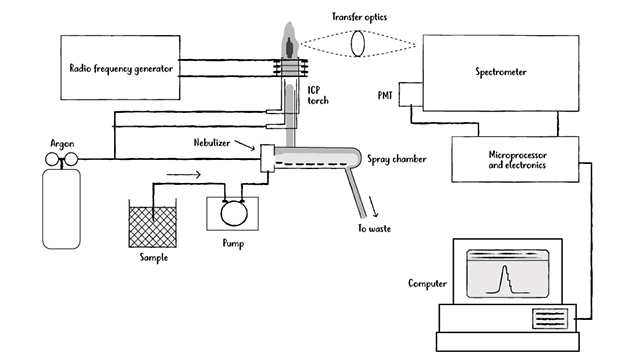
Figure 1: Example of an ICP-OES setup. Credit: Technology Networks
(a) High energy plasma. This plasma is most commonly composed of argon,5 although nitrogen gas6 and mixed gas compositions7 have also been reported. It is generated through the use of a high-power radio frequency signal8 or through microwave irradiation,9 which causes the gas to ionize to form electrons and other charged species within the plasma matrix.
(b) A sample aerosolizer. Interactions between the plasma matrix and the sample are critical for successful analysis, and obtaining those interactions requires the sample to be aerosolized. Aerosolizing of the sample generally occurs through the use of a nebulizer,10 and also needs a mechanism for sample transport from the injection port to the point of aerosolization.11 Following successful aerosolization, interactions between the high energy plasma and the sample result in degradation of the sample to its individual elements, each of which has a characteristic optical signal that can be detected spectroscopically (see part d).
(c) A wavelength separation mechanism. Although each individual element absorbs and emits light at a characteristic wavelength, signals from multiple elements often overlap, leading to significant challenges in interpreting the results obtained. To address this issue, the wavelengths corresponding to each element are separated, generally via an optical grating device,12 so that each element can be individually detected. The configuration of the system into either an axial configuration13 (where the plasma is viewed head-on) or radial configuration (where the plasma is viewed from the side) has additional effects on the ability to observe the target signals: although generally radial configurations show improved detection capabilities,14 advances in axial configurations’ detection capabilities have recently been reported.15
(d) A detector and signal processor. This detector, after correlating the wavelengths of light to the identity of the elements, is used to determine the final sample composition. It generally uses either a photomultiplier tube-type mechanism or a charge coupled device (CCD).16 Moreover, the detector is calibrated with known quantities of the elements targeted for analysis, so that it can effectively match the signals obtained from the sample to its pre-calibrated signals to allow for effective quantitation.17 Finally, there is a need to remove potentially interfering signals that can compromise detection of the target analyte, although recent studies have used these non-analyte signals to understand the broader matrix effects and overall system composition.18
Analyzing a sample by ICP-OES first requires one to determine if and how it can be effectively aerosolized. While this is a relatively straightforward process for liquid samples (which can be accomplished with a nebulizer, vide supra),19 solid samples require additional effort, such as the use of electrothermal vaporization,20 electrothermal evaporation,21 laser ablation,22 or spark ablation.23 Finally, gas sensing via ICP-OES tends to be a straightforward process, as no aerosolization is needed. Rather, such systems require a mechanism for gas capture and for introduction of the gaseous sample into the detection system.24
In addition to figuring out how to successfully introduce a sample into the system, one has a number of choices regarding system configuration, many of which are outlined above. Selecting the gas composition for the plasma can have measurable effects on the ability to ionize the gas effectively and determine atomic composition of the sample, as can the viewpoint (radial, axial, or dual)25 of the sensor relative to the generated plasma. Many of these choices, however, are made by manufacturers of ICP-OES instruments, and therefore are not necessarily within the purview of the individual ICP-OES user to decide.
Watch this video from the Teach Me in 10 series to get an introduction to IPC-OES with Ross Ashdown.
ICP-OES vs ICP-AES – Is there a difference?
Inductively coupled plasma optical emission spectroscopy (ICP-OES) and inductively coupled plasma atomic emission spectroscopy (ICP-AES) are used interchangeably in many scientific publications,26, 27, 28 as both represent the emission of photons from an ionized sample that can be deconvoluted into signals from each of the constituent elements.
How do you analyze ICP-OES data and what does it tell you?
General guidelines for analysis of ICP-OES data are to look at the intensity of light emitted at particular wavelengths and compare that to calibration data to determine the concentration of atoms that are emitted at that particular wavelength. Most instruments currently in use allow for the selection of multiple wavelengths, and the user should select wavelengths that correspond to the emission signals from the atoms of interest.29 After correct wavelength selection, identifying the elements within the sample is generally an automated process, and in recent years has become more sophisticated to facilitate multivariate analysis and highly sensitive identification.30
Other concerns in analyzing ICP-OES data relate to potential interferents and their ability to compromise the system performance. To eliminate undesired interferences prior to analysis, users are advised to use an internal standard to correct for sample-to-sample variability and differences in sample processing conditions.31 Commonly used internal standards are scandium32 and yttrium,33 chosen because their wavelengths generally do not overlap with those of other atoms in the sample. After the successful implementation of the internal standards, calibration data allows for a direct comparison of the light intensity obtained from the sample to light intensities of known sample compositions, providing the types of elements found in the sample and their relative ratios within that sample as the key readout data from ICP-OES.
 Figure 2: Typical line spectra produced by ICP-OES (left). The same spectra magnified in the y-axis demonstrates that, despite being spectral “lines”, they are still peaks and can thus suffer spectral interferences (right). This can be overcome by using software that enables selection of peaks that lack interference. Credit: Technology Networks

Figure 3: Example of a calibration curve. Credit: Technology Networks
Strengths and limitations of ICP-OES
Key strengths of ICP-OES include the ability to identify the types and ratios of elements in complex samples. For example, ICP-OES has been used effectively to analyze the composition of crude oil,34 contaminated soil,35 and heavy metal mixtures,36 all of which would have been challenging to analyze by other methods. Moreover, the ability to detect multiple elements simultaneously by ICP-OES presents another significant advantage,37, 38 with researchers reporting situations where ICP-OES has detected up to 19 elements in one analytical procedure.39 Advances in the ability to aerosolize a broader variety of samples has improved the general applicability of ICP-OES,40 as have advantages in spectral deconvolution41 and calibration procedures17 to facilitate effective detection. Even in the case of radioactive samples, ICP-OES can still be used to determine the elemental composition of the sample, with separate measurements used to determine the degree of radioactivity.42, 43 Finally, the ease of ICP-OES has allowed it to also be used in chemistry education contexts,44 with both analytical reagent grade and spectral pure grade solvents,45 and with relatively high throughput for sample preparation46 and analysis,47 highlighting the straightforward usability of the system.
Notable limitations of ICP-OES include the fact that samples must be aerosolized. Even though aerosolization procedures have undergone significant advances (vide supra), this means that solid and liquid samples cannot be analyzed while they are still in their solid and liquid forms. Moreover, ICP-OES is a destructive analytical procedure, meaning that the sample cannot be recovered after analysis. As a result, highly precious or rare samples cannot be analyzed via this method. Moreover, method development using ICP-OES can be a time-consuming process, as it necessarily involves multiple steps:28 (a) doing crude analysis to obtain a basic idea of the elements present in the sample; (b) wavelength selection based on that initial knowledge; (c) optimization of separation so that signals from the various wavelengths have limited overlap; (d) comparison with a internal standard to validate the method and system performance; and (e) analysis for spectral interferences and ways to eliminate those from the read-out without eliminating target signals. Finally, ICP-OES requires costly instrumentation for plasma generation, sample aerosolizing, and signal analysis, albeit at a relatively lower cost than other comparable methods such as ICP-MS,48 which means that access to this technique is necessarily limited.
Common problems with ICP-OES
Common problems with ICP-OES include poor precision,49 sample drift,50 non-ideal detection limits, and inaccurate identification.51 Each of these problems will be discussed in turn.
Poor precision is defined as a lack of reproducibility in results obtained for the same sample. Such challenges are likely to be due to issues in the sample introduction system, including mechanisms in which the sample is aerosolized, introduced into the system, and/or transported from the introduction site to the plasma matrix.
Sample drift refers to a situation in which the signal is not stable and changes in position over time. Such issues are usually due to instrument problems, including buildup of the parts of the sample that were not effectively aerosolized in the instrument tubing that slows flow rates, or degradation in the tubing due to highly acidic samples52 that cause system leakages.
Non-ideal detection limits means that in many cases, the detection limits obtained through the use of ICP-OES are higher than desired for the target application. While detection limits for ICP-OES can theoretically be as low as single digit parts-per-billion (ppb),53 they are more often reported in the parts-per-million (ppm) range.54, 55 Optimization of detection limits focuses on ensuring that sample preparation procedures limit dilution and/or sample degradation, as well as optimizing the view of the plasma-generated signal (axial, radial, or dual) to achieve the optimal signal capture.
Inaccurate identification refers to situations in which the ICP-OES signal identifies a signal as corresponding to one element when it in fact belongs to a different element. Such situations, while rare, can be minimized by selecting wavelengths for the desired elements that have limited overlap from competing elements. These situations have also been assisted by the recent application of multivariate spectral analysis to ICP-OES signal read-outs,56 which allows for the use of statistical analysis to deconvolute overlapping signals and facilitate accurate identification.
ICP-OES vs ICP-MS
ICP-OES is often compared to ICP-MS (inductively coupled plasma – mass spectrometry).57 ICP-MS operates using many of the same principles as ICP-OES, except that the detection of elements from the aerosolized and ionized sample occurs via mass spectral analysis rather than being based on photon emission. Key advantages to the use of ICP-MS compared to ICP-OES are that sensitivities of mass spectral-based techniques are higher, with ICP-MS able to obtain parts-per-trillion (ppt) detection limits.58 Disadvantages to the use of ICP-MS focus on the limited tolerance for total dissolved solids (TDS),59 which is markedly higher in ICP-OES, allowing for greater sample tolerance.


1. Resano M, Vanhaecke F, de Loos-Vollebregt MTC.
Electrothermal vaporization for sample introduction in atomic absorption,
atomic emission and plasma mass spectrometry-a critical review with focus on
solid sampling and slurry analysis. J. Anal. Atomic Spectrometry 2008;23(11):1450-1475.
doi: 10.1039/b807756h
2. Grochowski C, Blicharska E, Krukow P, Jonak K,
Maciejewski M, Szczepanek D, Jonak K, Flieger J, Maciejewski R. Analysis of
trace elements in human brain: its aim, methods, and concentration
levels. Frontiers Chem. 2019;7:115. doi: 10.3389/fchem.2019.00115
3. Famele M, Ferranti C, Abenavoli C, Palleschi L,
Mancinelli R, Draisci R. The chemical components of electronic cigarette
cartridges and refill fluids: review of analytical methods. Nicotine
Tobacco Res. 2015; 17(3):271-279. doi: 10.1093/ntr/ntu197
4. Majumdar AJ, Dubey N. Applications of
inductively coupled plasma-atomic emission spectrometry (ICP-OES) in impurity
profiling of pharmaceuticals. Int. J. Pharmacy Life Sci. 2017;
8(1):5420-5425. ISSN: 0976-7126
5. Vogt D, Vogt T, Wolf B, Neuroth M, Otto M.
Direct determination of organic and inorganic oxygen in coals from the Argonne
Premium Sample Program by solid sampling electrothermal vaporization
inductively coupled plasma optical emission spectrometry. Fuel 2017;196:185-194.
doi: 10.1016/j.fuel.2017.01.043
6. Muller A, Pozebon D, Dressler VL. Advances of
nitrogen microwave plasma for optical emission spectrometry and applications in
elemental analysis: a review. J. Anal. Atomic Spectrometry 2020;35(10):2113-2131.
doi: 10.1039/d0ja00272k
7. Scheffler GL, Pozebon D, Beauchemin D. Improving
the analytical performance of electrothermal vaporization coupled to
inductively coupled plasma optical emission spectrometry using a mixed-gas
plasma. J. Anal. Atomic Spectrometry 2019;34(5):891-898.
doi: 10.1039/c9ja00010k
8. Ariga T, Ido K, Zhu Y, Hokura A, Inagaki K. Cold
plasma: effective control of argon emission line interferences on the
measurement of rubidium by axial-view ICP-OES. Chem. Lett. 2017;46(12):1751-1753.
doi: 10.1246/cl.170808
9. Poirier L, Nelson J, Gilleland G, Wall S,
Berhane L, Lopez-Linares F. Comparison of preparation methods for the
determination of metals in petroleum fractions (1000 °F+) by microwave plasma
atomic emission spectroscopy. Energy & Fuels 2017;31(8):7809-7815.
doi: 10.1021/acs.energyfuels.7b00654
10. Ido K, Matsushita R, Fujii S-I, Miyashita
S-I, Umemura T, Hokura A, Inagaki K. Multiple-channel concentric grid nebulizer
for online standard addition in inductively coupled plasma optical emission
spectrometry. Anal. Sci. 2020;36(6):717-722. doi: 10.2116/analsci.19p385
11. Scheffer A, Engelhard C, Sperling M, Buscher W.
Introducing wet aerosols into the static high sensitivity ICP (SHIP). Anal.
Bioanal. Chem. 2007;388(8):1605-1613. doi: 10.1007/s00216-007-1378-9
12. Olesik JW. Echelle grating spectrometers for
inductively coupled plasma-optical emission spectrometry. A review of basic
equations and operating principles. Spectroscopy 1999;14(10):36-41. ISSN:0887-6703
13. Trevizan LC, Nobrega JA. Inductively coupled
plasma optical emission spectrometry with axially viewed configuration: an
overview of applications. J. Brazilian Chem. Soc. 2007;18(4):678-690.
doi: 10.1590/S0103-50532007000400003
14. dos Santos Froes RE, Couto e Silva NdO, Naveira
RLP, Jose da Silva JC, Ciminelli V, Sampaio T, Windmoller CC, Borba da Silva
JB. Determination of inorganic constituents in hemodialysis water samples using
inductively coupled plasma optical emission spectrometry with axially and
radially viewed configurations. Atomic Spectroscopy 2007;28(1):8-16.
ISSN:0195-5373
15. Schiavo D, Trevizan LC, Pereira-Filho ER,
Nobrega JA. Evaluation of the use of multiple lines for determination of metals
in water by inductively coupled plasma optical emission spectrometry with axial
viewing. Spectrochim. Acta B 2009;64B(6):544-548. doi: 10.1016/j.sab.2009.05.009
16. Barnard TW, Crockett MI, Ivaldi JC, Lundberg
PL, Yates DA, Levine, PA, Sauer DJ. Solid-state detector for ICP-OES. Anal.
Chem. 1993;65(9):1231-1239. doi: 10.1021/ac00057a021
17. Virgilio A, Silva ABS, Nogueira ARA, Nobrega
JA, Donati GL. Calculating limits of detection and defining working ranges for
multi-signal calibration methods. J. Anal. Atomic Spectrometry 2020;35(8):1614-1620.
doi: 10.1039/d0ja00212g
18. Carter JA, Sloop JT, Harville T, Jones BT,
Donati GL. Non-analyte signals and supervised learning to evaluate matrix
effects and predict analyte recoveries in inductively coupled plasma optical
emission spectrometry. J. Anal. Atomic Spectrometry 2020;35(4):679-692.
doi: 10.1039/d0ja00007h
19. Bings NH, Orlandini von Niessen JO, Schaper JN.
Liquid sample introduction in inductively coupled plasma atomic emission and
mass spectrometry - critical review. Spectrochim. Acta B 2014;100:14-37.
doi: 10.1016/j.sab.2014.08.011
20. Sadiq N, Huang L, Kaveh F, Beauchemin D. Solid
sampling ETV-ICPOES coupled to a nebulization/pre-evaporation system for
direct elemental analysis of glutinous rice by external calibration with
standard solutions. Food Chem. 2017;237:1-6. doi: 10.1016/j.foodchem.2017.05.063
21. Hassler J, Perzl PR. Electrothermal evaporation
in ICP-OES; its development and state-of-the-art nowadays. Slovak
Geological Magazine 2003;9(2-3):109-113. ISSN:1335-096X
22. Villasenor A, Boccongelli M, Todoli JL.
Quantitative elemental analysis of polymers through laser ablation -
inductively coupled plasma by using a dried droplet calibration approach,
DDCA. J. Anal. Atomic Spectrometry 2018;33(7):1173-1183.
doi: 10.1039/C8JA00055G
23. Aziz A, Broekaert JAC, Laqua K, Leis F. A
study of direct analysis of solid samples using spark ablation combined with
excitation in an inductively coupled plasma. Spectrochim. Acta B 1984;39B(9-11):1091-1103.
doi: 10.1016/0584-8547(84)80195-0
24. Wellinger M, Wochele J, Biollaz SMA,
Ludwig C. Online elemental analysis of process gases with ICP-OES: a case
study on waste wood combustion. Waste Management 2012;32(10):1843-1852.
doi: 10.1016/j.wasman.2012.05.015
25. Silva JCJ, Baccan N, Nobrega JA.
Analytical performance of an inductively coupled plasma optical emission
spectrometry with dual view configuration. J. Brazilian Chem.
Soc. 2003;14(2):310-315. doi: 10.1590/S0103-50532003000200020
26. Cindric IJ, Zeiner M, Steffan I. Trace
elemental characterization of edible oils by ICP-AES and GFAAS. Microchem.
J. 2007;85(1):136-139. doi: 10.1016/j.microc.2006.04.011
27. Lv Y, Zhang H, Wang G, Xia C, Gao F, Zhang
Y, Qiao H, Xie Y, Qin W, Qian X. A novel mass spectrometry method for the
absolute quantification of several cytochrome P450 and uridine
5'-diphospho-glucuronosyltransferase enzymes in the human liver. Anal.
Bioanal. Chem. 2020;412(8):1729-1740. doi: 10.1007/s00216-020-02445-7
28. Rao Katakam L N, Aboul-Enein HY. Elemental
impurities determination by ICP-AES / ICP-MS: a review of theory,
interpretation of concentration limits, analytical method development
challenges and validation criterion for pharmaceutical dosage forms. Curr.
Pharmaceutical Anal. 2020;16(4):392-403. doi: 10.2174/1573412915666190225160512
29. Kulkarni NM. Determination of heavy metals
in animal feed by inductive coupled plasma-optical emission spectrometry
(ICP-OES). Int. Archive Appl. Sci. Technol. 2018;9(4):58-61.
doi: 10.15515/iaast.0976-4828.9.4.5861
30. Rodrigues NP, Rodrigues E, Celso PG,
Kahmann A, Yamashita GH, Anzanello MJ, Manfroi V, Hertz PF. Discrimination of
sparkling wines samples according to the country of origin by ICP-OES coupled
with multivariate analysis. LWT – Food Sci. Technol. 2020;131:109760.
doi: 10.1016/j.lwt.2020.109760
31. Drava G, Minganti V. Influence of an
internal standard in axial ICP OES analysis of trace elements in plant
materials. J. Anal. Atomic Spectrometry 2020;35(2):301-306. doi: 10.1039/c9ja00372j
32. Chiweshe TT, Purcell W, Venter JA.
Evaluation of different internal standards for precious metals
quantification. Bull. Chem. Soc. Ethiopia 2016;30(1):55-70.
doi: 10.4314/bcse.v30i1.5
33. Gao R, Zhang N. ICP-OES determination of
palladium in palladium jewellery alloys using yttrium internal standard. Atomic
Spectroscopy 2015;36(5):216-220. ISSN:0195-5373
34. de Oliveira Souza M, Ribeiro MA, Carneiro
MTWD, Athayde GPB, de Castro EVR, da Silva FLF, Matos WO, de Queiroz Ferreira
R. Evaluation and determination of chloride in crude oil based on the
counterions Na, Ca, Mg, Sr and Fe, quantified via ICP-OES in the crude oil
aqueous extract. Fuel 2015;154:181-187. doi: 10.1016/j.fuel.2015.03.079
35. Battsengel E, Murayama T, Fukushi K,
Nishikizawa S, Chonokhuu S, Ochir A, Tsetsgee S, Davaasuren D. Ecological and
human health risk assessment of heavy metal pollution in the soil of the Ger
district in Ulaanbaatar, Mongolia. Int. J. Environ. Res. Public Health 2020;17(13):4668.
doi: 10.3390/ijerph17134668
36. Tunali M, Tunali MM, Yenigun O.
Characterization of different types of electronic waste: heavy metal, precious
metal and rare earth element content by comparing different digestion
methods. J. Mater. Cycles Waste Management 2020, Ahead
of Print. doi: 10.1007/s10163-020-01108-0
37. Li FK, Gong AJ, Qiu LN, Zhang WW, Li JR,
Liu Y, Liu YN, Yuan HT. Simultaneous determination of trace rare earth elements
in simulated water samples using ICP-OES with TODGA extraction/ back
extraction. PLoS One 2017;12(9):e0185302/1-e0185302/16.
doi: 10.1371/journal.pone.0185302
38. Taftazani A, Roto R, Ananda NR, Murniasih
S. Comparison of NAA XRF and ICP-OES methods on analysis of heavy metals in
coals and combustion residues. Indonesian J. Chem. 2017;17(2):228-237.
doi: 10.22146/ijc.17686
39. Tosic SB, Mitic SS, Velimirovic DS,
Stojanovic GS, Pavlovic AN, Pecev-Marinkovic ET. Elemental composition of
edible nuts: fast optimization and validation procedure of an ICP-OES
method. J. Sci. Food Agriculture 2015;95(11):2271-2278.
doi: 10.1002/jsfa.6946
40. Lee H, Kim G, Kim H-A, Maeng H, Park H,
Park K. Application of laser-induced breakdown spectroscopy for detection of
elements in flowback water samples from shale gas wells. Appl.
Optics 2020;59(8):2254-2261. E-ISSN:1539-4522
41. Zhang Z, Ma X. Methods for correction of
spectral interferences in inductively coupled plasma atomic emission
spectrometry. Curr. Topics Anal. Chem. 2002;3:105-123. CODEN: CACHFQ
42. Wakasugi DSM, Damatto SR, Ulrich JC.
Natural radionuclides 226Ra, 228Ra, 210Pb and 210Po and inorganic chemical
elements determined in mineral waters from A´guas de Contendas and Lambari,
Brazil. J. Radioanal. Nuclear Chem. 2020;326(1):51-63.
doi: 10.1007/s10967-020-07357-5
43. Alseroury FA, Almeelbi T, Khan A, Barakata
MA, Al-Zahrani JH, Alali W. Estimation of natural radioactive and heavy metals
concentration in underground water. J. Radiation Res. Appl. Sci. 2018;11(4):373-378.
doi: 10.1016/j.jrras.2018.07.004
44. Brittle SW, Baker JD, Dorney KM, Dagher
JM, Ebrahimian T, Higgins SR, Pavel Sizemore IE. Measuring the silver
composition of nanocolloids by inductively coupled plasma-optical emission
spectroscopy: a laboratory experiment for chemistry and engineering students. J.
Chem. Educ. 2015;92(6):1061-1065. doi: 10.1021/ed500707k
45. Cui C, He M, Hu B. Membrane solid phase
microextraction with alumina hollow fiber on line coupled with ICP-OES for the
determination of trace copper, manganese and nickel in environmental water
samples. J. Hazardous Mater. 2011; 187(1-3):379-385.
doi: 10.1016/j.jhazmat.2011.01.038
46. Liu N, Joergensen U, Laerke PE. Quality
determination of biomass for combustion: a new high-throughput microwave
digestion method prior to elemental analysis by inductively coupled
plasma-optical emission spectroscopy. Energy & Fuels 2013;27(12):7485-7488.
doi: 10.1021/ef4016747
47. Ranjbar L, Yamini Y, Saleh A, Seidi S,
Faraji M. Ionic liquid based dispersive liquid-liquid microextraction combined
with ICP-OES for the determination of trace quantities of cobalt, copper,
manganese, nickel and zinc in environmental water samples. Microchim.
Acta 2012;177(1-2):119-127. doi: 10.1007/s00604-011-0757-2
48. Lee Y-J, Heo SW, Han M-S, Lim Y, Yim Y-H.
Development of exact matrix-matching inductively coupled plasma-optical
emission spectroscopy for the analysis of Cu and K in infant formula. Bull.
Korean Chem. Soc. 2016;37(8):1228-1233. doi: 10.1002/bkcs.10843
49. Nizio KD, Harynuk JJ. Analysis of alkyl
phosphates in petroleum samples by comprehensive two-dimensional gas
chromatography with nitrogen phosphorus detection and post-column deans
switching. J. Chromatography A 2012, 1252,
171-176. doi: 10.1016/j.chroma.2012.06.070
50. Merson S, Evans P. A high accuracy
reference method for the determination of minor elements in steel by
ICP-OES. J. Anal. Atomic Spectrometry 2003, 18,
372-375. doi: 10.1039/B301688A
51. Jantzi SC, Motto-Ros V, Trichard F,
Markushin Y, Melikechi N, De Giacomo A. Sample treatment and preparation for
laser-induced breakdown spectroscopy. Spectrochim. Acta B 2016;115:52-63. doi: 10.1016/j.sab.2015.11.002
52. Smirnova SV, Ilin DV, Pletnev IV.
Extraction and ICP-OES determination of heavy metals using tetrabutylammonium
bromide aqueous biphasic system and oleophilic collector. Talanta 2021, 221,
121485. doi: 10.1016/j.talanta.2020.121485
53. Vogel K, Wegener A, Pursch M, Luschas P,
Wiesmann M. SEC-ICP-OES hyphenation: speciation and quantification of
polydimethylsiloxanes at trace levels. Spectroscopy 2019;
34(1):38-46. ISSN: 1939-1900
54. Wiltsche H, Wolfgang M. Merits of
microwave plasmas for optical emission spectrometry - characterization of an
axially viewed microwave-sustained, inductively coupled, atmospheric-pressure
plasma (MICAP). J. Anal. Atomic Spectrometry 2020, 35,
2369-2377. doi: 10.1039/D0JA00293C
55. Baraud F, Zaiter A, Poree S, Leleyter L.
New approach for determination of Cd, Cu, Cr, Ni, Pb, and Zn in sewage sludges,
fired brick, and sediments using two analytical methods by microwave-induced
plasma optical spectrometry and induced coupled plasma optical
spectrometry. SN Appl. Sci. 2020, 2, 1536.
doi: 10.1007/s42452-020-03220-0
56. Atikul Islam M, Hwang IM, Khan N, Yeon
Song O, Young Jeong J, Hyeon Son J, Jamila N, Kim KS. Authentication of leaves
and petioles of Piper betle L. varieties via elemental composition and
multivariate chemometric analysis. Anal. Lett. 2020, Ahead
of Print; doi: 10.1080/00032719.2020.1825465
57. Sneddon J, Vincent MD. ICP-OES and
ICP-MS for the determination of metals: application to oysters. Anal.
Lett. 2008;41(8):1291-1303. doi: 10.1080/00032710802013991
58. Barin JS, Mello PA, Mesko MF, Duarte FA,
Flores EMM. Determination of elemental impurities in pharmaceutical products
and related matrices by ICP-based methods: a review. Anal. Bioanal.
Chem. 2016, 408, 4547-4566. doi: 10.1007/s00216-016-9471-6
59. Chini MK, Purohit S, Bheemaraju A,
Chakraborty T, Singh KP, Ivaturi A, Satapathi S. Carbon-based adsorbents from
naturally available Bermuda grasses: removal of TDS and arsenic ions. ChemistrySelect 2020, 5,
7571-7580. doi: 10.1002/slct.201902892