Solving Challenges of Automated 1D and 2D Quantitative Nuclear Magnetic Resonance (qNMR) Spectroscopy Using CRAFT

Complete the form below to unlock access to ALL audio articles.
The introduction of ”two-dimensional” (2D) nuclear magnetic resonance (NMR) spectroscopy in the mid-1970s is generally accepted to be a defining advance in modern NMR analysis. This was the work of Richard Ernst and his colleagues in Zurich, Switzerland, the same group that had, around 10 years earlier, developed Fourier-transform (FT) NMR. Both milestones were rewarded with the Nobel Prize for Chemistry in 1991.
Fast forward to more recent times, when the desire for automated quantitative NMR (qNMR) analysis has become the challenge to solve. Approaches that either increase the throughput of data collection and/or reduce the spectral information collected to a tabular format have been a focus of attention. However, particularly for highly-complex samples, bottlenecks can persist such that critical, manual intervention, and guidance become necessary from the user.
Time-domain analysis (i.e. extraction of frequency, amplitude, line width, and phase directly from the FID) has been proposed in the past for data reduction to a table. Now, the fast-developing CRAFT (Complete Reduction to Amplitude Frequency Table) [1] approach is not only the established alternative to the conventional steps in data processing for “one-dimensional“ (1D) applications, but also relevant in the realm of 2D analysis too.
In this article, we present recent data from a series of 1D and 2D qNMR applications of CRAFT – including classic quant-purity analysis, mixture analysis, and complex non-targeted studies.
Why 2D NMR?
The early experiments leading to the development of 2D NMR have been written about extensively – with a 2015 article in Resonance [2] and the documents that accompany the award of the 1991 Nobel Prize for chemistry [3] – perhaps the ideal background for an interested reader.
In summary, 2D NMR uses nuclear spins in a magnetic field that are subjected to sequences of radio-frequency pulses rather than to single pulses. The time course of the experiment is divided into four intervals. During the “preparation period”, the equilibrium of the nuclear spin system is distorted by one or several pulses. This non-equilibrium is allowed to evolve for a certain time (the “evolution period”), after which the next series of pulses (the “mixing period”) leads to the ”detection period”. Here the NMR signal is detected as a function of time in the same way as in ordinary, 1D FT NMR.
A further preparation period is instigated, and the experiment is repeated with a different evolution period. The change in the evolution period causes the signal measured during the detection period to change. This gives a 2D table with signal intensity as a function of both the point in time during the detection period and the length of the evolution period. Finally, the Fourier transformation is performed twice – with respect to both these time parameters – to obtain a 2D frequency spectrum in the form of a map of the dependence of the signal intensity on two frequency parameters.
The spectral information generated is of much higher resolution, enabling discrimination of overlapping peaks. Depending on the design of the preparation and the mixing periods, a variety of 2D NMR experiments can be completed. Some spread the information over two dimensions rather than one (separation of interactions) while others are designed to find which nuclei have some form of contact with each other (correlation of signals), for example.
Key benefits of qNMR
NMR can be used for almost any organic compound that can be made into a solution. Importantly, substances difficult to analyze quantitatively using chromatography where there is no standard substance available, such as new compounds, or unknown materials, can be quantitatively analyzed using qNMR. It is possible to use one reference substance for the quantitative analysis of many measurement targets.
There is no need to create calibration curves for qNMR and no conditioning is required for performing a measurement. If an appropriate protocol is followed, qNMR can be used to perform SI traceable purity assessments, therefore the reliability of the results can be assured.
Measurement conditions for routine proton NMR are not suitable for quantitative analysis.
Figure 1 shows a comparison of the typical parameters for routine conditions and for quantitative conditions. The routine conditions are the default settings of the instrument used for proton measurement. The quantitative conditions are based on the conditions specified in the Japanese Pharmacopoeia. The parameter differences can be very broad, but there are six specific parameters that should be considered, with pulse repetition time and the number of scans two of the most important.
| Typical parameters | Routine | Quantitative |
| Pulse repetition time | ~7 sec | >T1 x 7 |
| Pulse flip angle | 45 ° | 90 ° |
| Scans | 8 | S/N > 100 |
| Digital resolution | 0.5 Hz | < 0.25 Hz |
| Sample spinning | On | Off |
| 13C decoupling | Off | On |
Figure 1: Typical parameters for routine and quantitative measurement conditions.
CRAFT
First proposed as a robust and time-efficient approach for quantitative mixture analysis in 2013, CRAFT uses a Bayesian statistical approach to convert NMR time-domain data directly to the tabular domain (Figure 2). With CRAFT, the frequency domain data (the “spectrum”) is no more than a visualization tool for the tabular domain, in contrast to “conventional processes” where the tabular domain is derived from the spectrum by an experienced spectroscopist. The reconstruction, after the fact, of model data taken from each component of the amplitude frequency table of an example 1H-NMR measurement of brucine is shown in Figure 3. Note that the reconstructed trace (green) is almost identical to the original, measured, trace (blue) – the small differences are shown on the residual trace (brown).
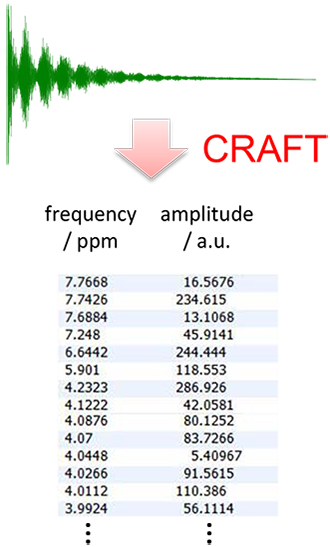
Figure 2: Output from CRAFT: data directly in tabular form.

Figure 3: CRAFT analysis of 1H-NMR for brucine.
CRAFT in practice
Study 1. Targeted analysis of complex mixture using 1D NMR
Here, CRAFT is used to quantitate a compound in a very complex mixture. In this series of experiments, NMR quantification of cholesterol in egg yolk was performed using CRAFT. The materials and methods used to prepare an appropriate sample are shown in Figure 4.
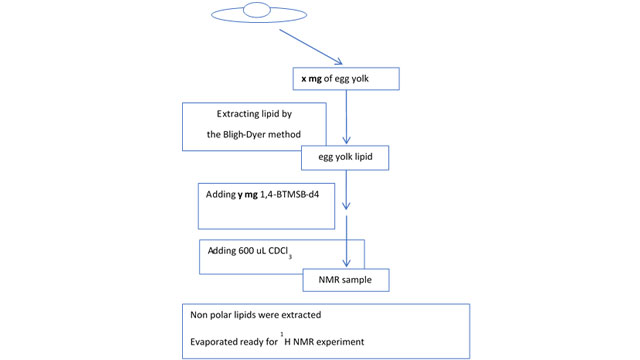
Figure 4: Materials and methods: to prepare egg yolk sample for NMR.
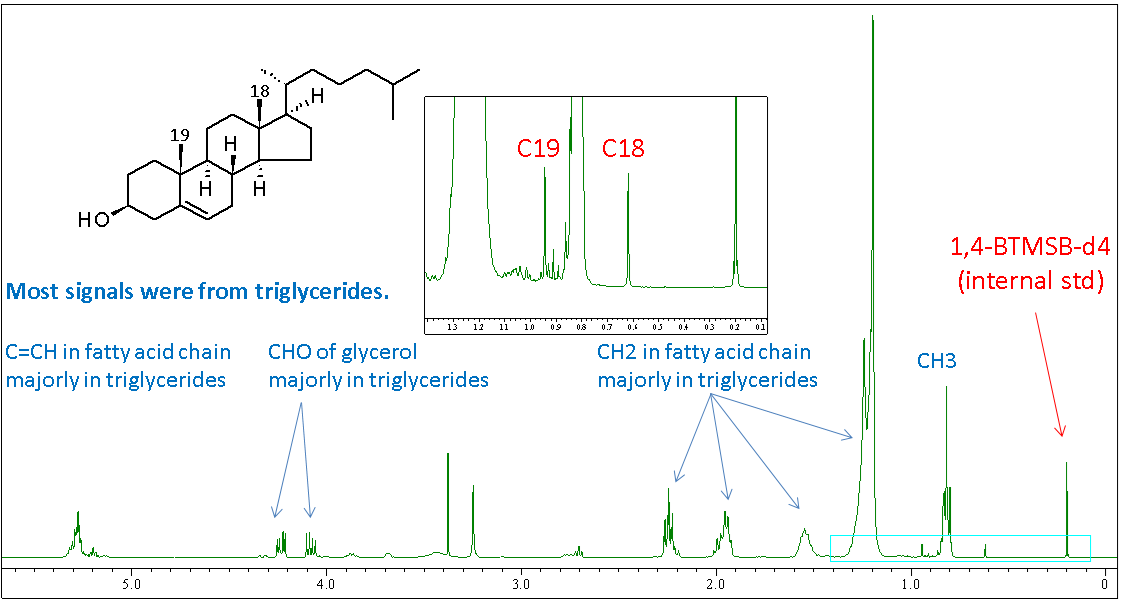
Figure 5: 1H quantitative NMR spectrum of egg yolk lipid with internal standard.
The 1H quantitative NMR spectrum of egg yolk lipid with internal standard was collected (Figure 5). Most signals were from triglycerides. The C18 and C19 methyl proton signals in cholesterol are highlighted, and these were used for further quantitative analysis.

Figure 6: 1H quantitative NMR spectrum of egg yolk lipid with internal standard.
Figure 6 shows how the amplitude of each signal for quantification was set. After defining fingerprints for each signal, the region of interest (ROI) was defined (box 1 in Figure 6). The resulting CRAFT result is shown in the lower panel – amplitudes of standard, C18 and C19 of cholesterol were 62.6, 22.8, and 21.2 respectively.
The conclusion: these data were taken forward to calculate the absolute amount of cholesterol in the sample, which was found to be 0.929 mg/100 mg of egg yolk (Figure 7).

Figure 7: Calculating cholesterol amount (as free form) in egg yolk.
Study 2. Non-targeted analysis, NMR metabolomic study
With no standards and no fingerprinting, CRAFT also excels in non-targeted analysis. Here, we explore any differences in metabolites in broccoli seeds that have been grown with or without light.
The seeds were sown on 1 wt % agar gel. Half were grown with light and the other half were grown without light for 10 days (Figure 8a). Polar metabolites were extracted from seedling of broccoli by the Bligh-Dyer method and a series of 1H spectra of were captured. The Y range in the aromatic region (8.5-5.0 ppm) was scaled - eight times larger than that in the aliphatic region (4.7-0.5 ppm). Eight experimental replicates were performed in each sample group. NMR spectra were recorded continuously on a spectrometer equipped with a probe and auto sample changer.
Figure 8b shows how the data matrix for the non-target approach was created – 16 spectra (8 with and 8 without) were opened. Fingerprinting was not defined here, we simply started analysis and waited for CRAFT to complete.
Orthogonal projections to latent structures discriminant analysis (OPLS-DA), multivariate discrimination analysis, was performed to explore metabolites in particular sample groups (Figure 8c). The frequency and amplitude table from the CRAFT analysis was used as an input matrix, each sample was normalized by total sum, and each frequency was scaled by auto-scale. The score plot in OPLS-DA shows good discrimination, and the R2 and Q2 values indicate that the model is valid. A scatter plot of ‘variable influence on projection’ (VIP) vs p-values of the difference in average between two sample groups were shown.
If we consider that metabolites with a VIP value of more than 1, and a p-value of less than 0.05 are characteristic, we see 12 characteristic frequencies between the two sample groups successfully identified here. Figure 8d shows boxplots of these metabolites, giving good visualizations of the distribution of amount between two sample groups. Here, metabolites related to energy metabolism were relatively higher in plants grown with light than those without light. Also, several amino acids were relatively higher in plants grown without light than those with light.
The conclusion: characteristic metabolites between the different sample groups were successfully identified and relatively quantified with CRAFT.
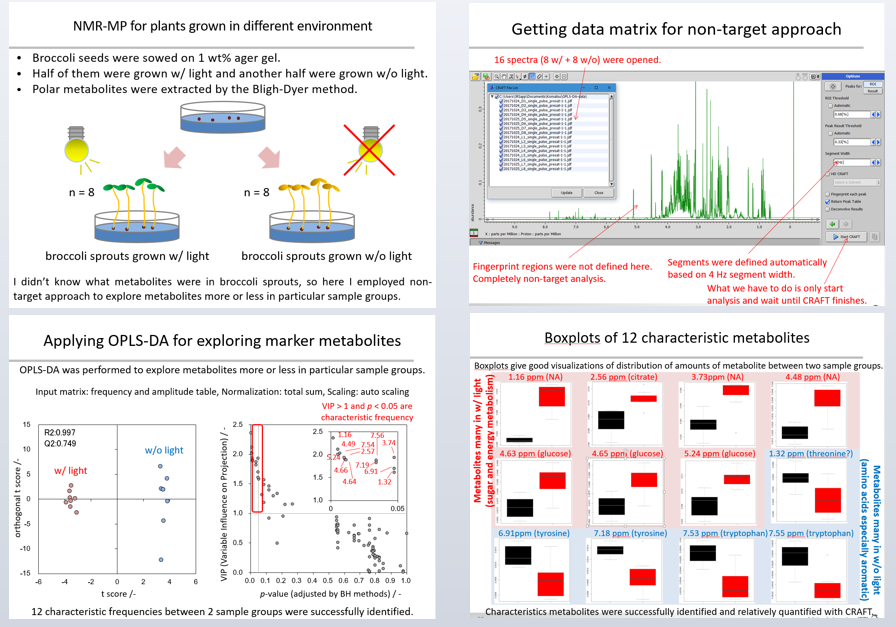
Figure 8 a-d: Experimental set up (a) / generating data matrix (b) / OPLS-DA for exploring marker metabolites (c) / boxplots of 12 characteristic metabolites (d).
Study 3. Santonin / adenosine mixture by 2D qNMR
Conventional NMR spectra (1D spectra) are plots of intensity vs. frequency; in 2D spectroscopy intensity is plotted as a function of two frequencies, usually called F1 and F2. While the principal advantage afforded by 2D CRAFT is the greatly enhanced F1 resolution [4] recent studies have indicated it also has potential to mine 2D NMR data for amplitude. By obtaining sums of cross-peak amplitudes for reference compounds and then comparing with data from mixtures that have been acquired with identical pulse programmes, a straightforward route to 2D quantification is obtainable. Figure 9 shows amplitudes for three runs with 2D heteronuclear single quantum coherence (HSQC) for santonin and adenosine. Using these known concentrations and sum of amplitudes, the reference candles are established. The analysis of mixtures of the two reference compounds, with amplitudes reported by 2D CRAFT can be seen in Figure 10.
The conclusion: simple ration computation yields quantification in excellent agreement with the known concentrations. 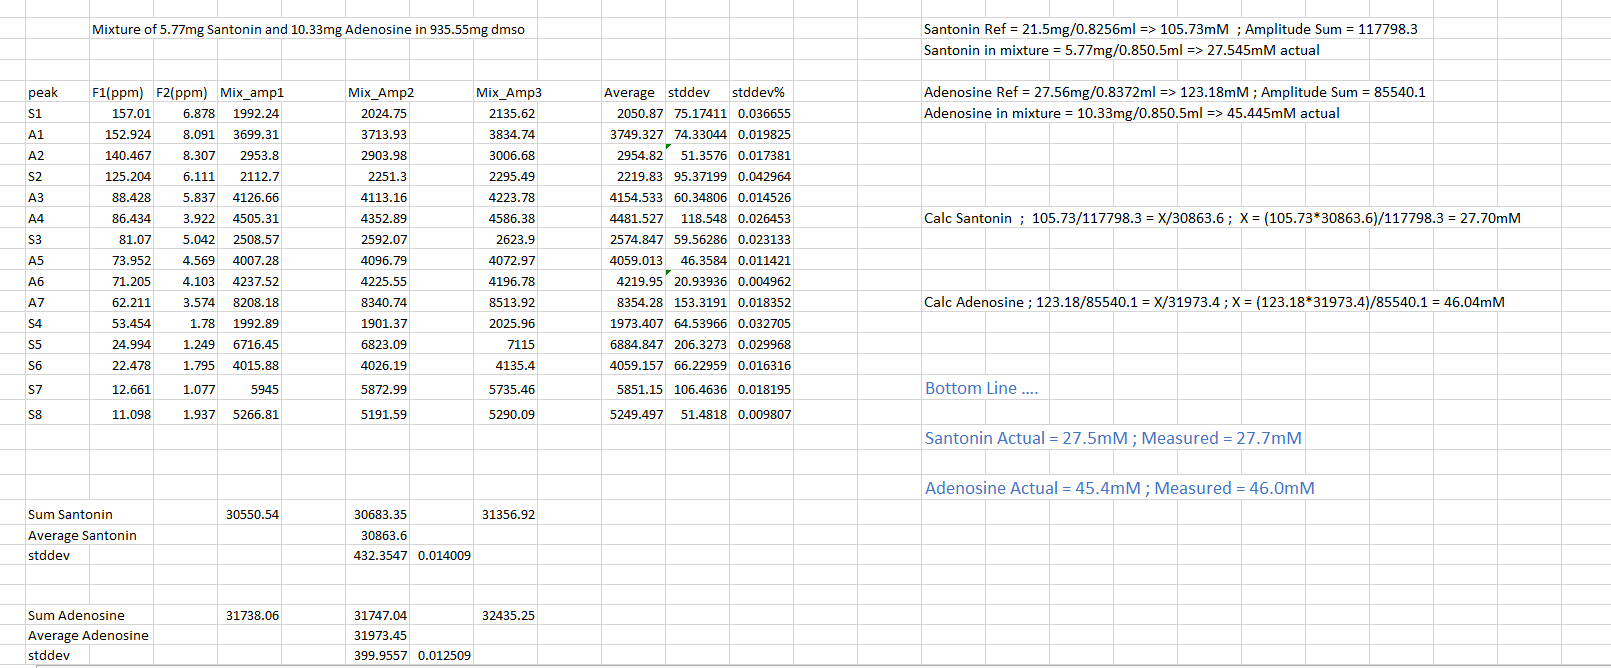
Figure 9: Santonin and Adenosine reference standards. 4 sec rep rate xy16bebop HSQC.

Figure 10: Analysis of santonin and adenosine mixture based on ratios from reference standards.
Summary
CRAFT is rapidly evolving to conveniently allow both targeted and non-targeted quantitative analysis for 1D and 2D experiments. As we have seen above, comparisons of amplitudes for 2D cross-peaks obtained by traditional 2D peak-pick and 2D CRAFT have been found to present virtually identical ratios, 2D CRAFT has the advantage of not requiring user intervention. In addition, fingerprinting tools can now enhance significantly the automatic organization of spreadsheet results output, meaning that the goal of automated analysis moves closer – replacing human insight and effort with non-operator-biased computational power. The coming months and years look set to see the dramatic rise of CRAFT applications continue.
References
[1] CRAFT – Complete Reduction to Amplitude Frequency Table – robust and time-efficient Bayesian approach for quantitative mixture analysis by NMR, Krish Krishnamurthy, Magn. Reson. Chem, 51, pp 821-829 (2013).
[2] Development of Two-Dimensional NMR: Structure Determination of Biomolecules in Solution. Anil Kumar. Resonance (2015) https://www.ias.ac.in/article/fulltext/reso/020/11/0995-1002.
[3] MLA style: The Nobel Prize in Chemistry 1991. NobelPrize.org (2019) https://www.nobelprize.org/prizes/chemistry/1991/summary/.
[4] Application of CRAFT in two-dimensional NMR data processing. Krish Krishnamurthy, Andrea M. Sefler, and David J. Russell, Magn. Reson. Chem. Special article DOI 10.1002/mrc.4449, 10 May 2016.

