Mass Spectrometry Ionization

Complete the form below to unlock access to ALL audio articles.
What are the ionization techniques for mass spectrometry?
Mass spectrometry (MS) plays a vital role in many aspects of our lives, from diagnosing illness and detecting food contaminants to fighting fraud. In order for a sample to be analyzed by MS, it must however, first be ionized. There are a number of ways of achieving sample ionization depending on the sample type, target analyte and desired workflow. These include gas phase methods (electron ionization (EI), chemical ionization (CI), direct analysis in real time (DART) and inductively coupled plasma (ICP)), desorption methods (matrix assisted laser desorption ionization (MALDI), fast atom bombardment (FAB), thermal ionization sources, plasma ionization sources and liquid metal ion sources (LMIS)) and spray methods (electrospray ionization (ESI) and desorption electrospray ionization (DESI)). In this article, we consider some common ionization techniques and sample types for which they are best suited.
- Electron ionization (EI)
- Chemical ionization (CI)
- Direct analysis in real time (DART)
- Inductively coupled plasma (ICP)
Ion sources – desorption methods
- Matrix assisted laser desorption ionization (MALDI)
- Fast atom bombardment (FAB)
- Thermal ionization sources
- Plasma ionization sources
- Liquid metal ion sources (LMIS)
Ion sources - spray methods
- Electrospray ionization (ESI)
- Desorption electrospray ionization (DESI)
Ion sources – gas phase methods
Many of the most common techniques used for ionization are described below. Further details are available in the review by Siuzdak.1
Electron ionization (EI)
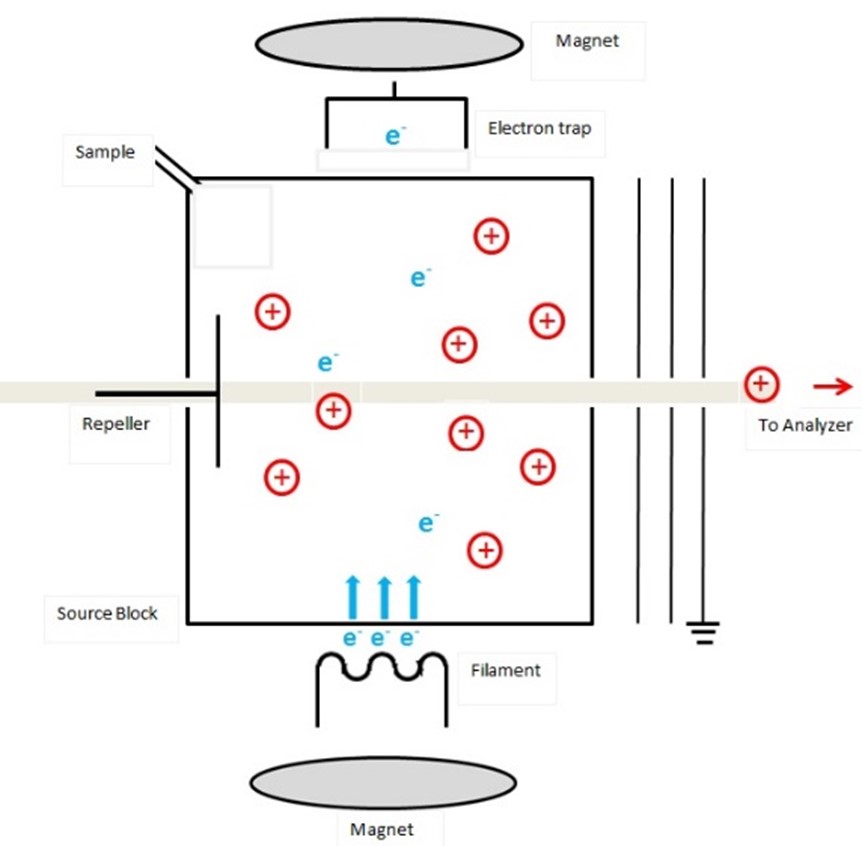
EI was first developed by Dempster in 19182 and can be considered a fairly harsh method of molecule fragmentation and ionization. In EI, the molecules of the analyte must be in the vapor phase to allow effective interaction with the energetic electrons produced in vacuum by a heated filament (much like an incandescent light bulb). The electrons produced by the ion source typically have 70 eV of kinetic energy. If only 10-12 eV of this energy is absorbed by the molecule, it puts the molecule in a state where it has significant energy in excess of its ionization potential which results in the ejection of an electron (Figure 1). This leaves the molecule in an ionized state with a net positive charge. It may, however, still have excess energy to dissipate. One way it can accomplish this is by fragmenting chemical bonds to produce a more stable ion. Thus, with knowledge of organic and physical chemistry, it may also be possible to deduce information about the structure of the molecular compound through these fragmentation processes.

Figure 1: Schematic diagram of an electron ionization ion source. Credit: Thilini Ukwaththage, reproduced under the Creative Commons Attribution-Share Alike 4.0 International license.
EI is most commonly used when samples are relatively volatile and have low molecular weight. They are often introduced to the ionization source in the form of an effluent from a gas chromatography (GC) system or are volatilized by heating a solid sample in situ within the ionization chamber.3
Chemical ionization (CI)
In contrast to EI, CI is a very soft ionization technique and does not lead to extensive fragmentation of analyte molecules. In fact, some molecular species (e.g., alcohols, ethers, amines, amino acids) undergo so much fragmentation under EI that no peaks are observed in the resulting mass spectrum for the intact molecule. For these types of molecules, CI may be the preferred ionization method.
In CI, a gas (commonly methane, ammonia or isobutane) is introduced into an EI ionization chamber at a concentration higher than that of the analyte. The interaction of the carrier gas with the electrons will produce several molecular ions, which will subsequently react further with the excess carrier gas and form different molecular ions (Figure 2). These ions will then react with the analyte molecules to form analyte molecular ions through several different mechanisms.4

Figure 2: A schematic diagram of chemical ionization in mass spectrometry. Credit: OviniW, reproduced under the Creative Commons Attribution-Share Alike 4.0 International license.
As this low-energy ionization mechanism results in significantly less fragmentation, the resulting mass spectrum is often simpler to interpret with far fewer peaks. Additionally, it will typically show a strong, easily identified protonated analyte molecular ion peak, allowing easy determination of molecular mass. However, the lack of fragmentation limits the amount of structural information that can be determined about the analyte molecule.
Direct analysis in real time (DART)
The DART source was developed in 2003 and fully commercialized in 2005.5 Its strength lies in its ability to analyze materials of different shapes and sizes with no prior sample preparation required.
In the DART source (Figure 3), a plasma from nitrogen or helium is first created, producing ions, electrons and excited-state species. The gas flows from the plasma chamber to a second chamber where ions are removed from the gas. The gas then passes to a third section of the source where it can be heated if desired, which aids desorption of some materials.5,6 The gas exits the source through a grid electrode which serves several purposes to enhance signal and can be directed towards a liquid, solid or vapor phase sample located in front of an inlet to the mass spectrometer. The interaction of the excited state species is responsible for the ionization of the analyte molecule. The mechanisms by which this occurs are complex and depend on a variety of factors.7

Figure 3: Schematic diagram of a DART source. Credit: Rbcody, recreated under the Creative Commons Attribution-Share Alike 4.0 International license.
The DART source has found widespread application as a result of its flexibility and ability to analyze in ambient atmosphere. Common uses include testing for illicit drugs and forensics as well as in analysis of food.8,9
Inductively coupled plasma (ICP)
ICP is typically used for liquid samples (which may be acid digestions of solid materials). In its simplest form, ICP takes a pre-prepared liquid containing the analyte and pumps it through a nebulizer to create an aerosol which is introduced into an argon gas plasma. As the liquid droplets enter the high temperature plasma (~ 5500-6500 K), they are converted to the gaseous state. Upon absorbing more energy, they will eventually release an electron to form a single, positively charged ion (Figure 4).

Figure 4: Schematic diagram of an ICP source.
ICP has the ability to ionize almost all elements, including those with the highest ionization potentials. This method also lends itself very well to the use of the effluents of other separation techniques, such as liquid chromatography (LC), GC, capillary electrophoresis (CE) and gel electrophoresis (GE), all of which can isolate an element of interest and forward them on to the ICP system for ionization and eventual mass spectrometric detection. More details on inductively coupled plasma-mass spectrometry (ICP-MS) can be found here.
Ion sources – desorption methods
Matrix assisted laser desorption ionization (MALDI)
The MALDI method was first developed in 198510 and has since become one of the major “soft” ionization methods used in MS. It is particularly useful for the analysis of large or labile molecules, such as proteins, peptides, oligonucleotides, polymers and lipids.
The technique employs a “matrix” which is added in excess to the sample to be analyzed (Figure 5). The matrix requires the following properties:
- Must be able to co-crystallize with the analyte to form a solid solution
- Be able to transfer or accept protons from the analyte
- Be chemically inert
- Stable under vacuum and soluble in solvents

Figure 5: Schematic diagram of a MALDI source. Credit: Mikayé, reproduced under the Creative Commons Attribution-Share Alike 3.0 Unported, 2.5 Generic, 2.0 Generic and 1.0 Generic licenses.
Commonly used matrices include 2,5-dihydroxybenzoic acid, sinapinic acid, α-cyano-4-hydroxycinnamic acid and picolinic acid to name but a few.11 The matrix chosen will be dictated by the type of molecule to be detected.
Once the matrix has been applied, the sample is then irradiated by a laser. This not only transfers energy to the matrix and vaporizes the analyte molecules with little to no fragmentation or decomposition, but also provides the ionization mechanism to produce a positively or negatively charged ion.
Fast atom bombardment (FAB)
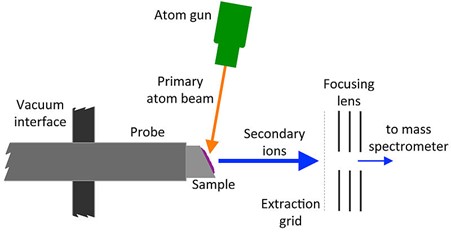
FAB is another soft ionization mechanism where a beam of accelerated atoms, typically inert gases such as argon or xenon, is focused onto the sample to be analyzed.12,13 In order to create the “fast” beam, the atoms must first themselves be ionized such that they can be accelerated by applications of high electric fields and focused using electrostatic lenses. By directing this beam of ions into a collision cell containing the same inert gas, charge exchange reactions will occur, neutralizing the inert gas ions.

Figure 6: Schematic diagram of FAB ionization. Credit: Kkmurray, reproduced under the Creative Commons Attribution-Share Alike 4.0 International license.
Similar to MALDI, a matrix is used, typically glycerol. In the case of FAB, this is to reduce damage to the sample that may be caused by the beam of atoms, to prevent aggregation of the analyte molecules and (as in MALDI) to promote ionization of the analyte molecules that are ejected. Also, similar to MALDI, the ionization method produces positive ions by protonation and negative ions by deprotonation.
Thermal ionization sources
The most common type of thermal ionization source encountered in MS is that of the Cs+ primary ion source, used regularly in secondary ion MS experiments. It is a relatively simple source containing two main components: the reservoir, which contains the source of Cs, and the ionizer, which is a porous tungsten frit held at high temperature (> 1000 °C) which provides the thermal energy to ionize Cs atoms. The reservoir contains a pellet of Cs carbonate (chromate has also been used) which is warmed to sublime the material to produce a vapor of Cs atoms. When these atoms reach the hot frit, they are ionized as positive ions and can be extracted and focused with electrostatic ion optics elements. Old systems used liquid Cs as the source material, but due to the inherent danger of handling this material during source changes it is no longer generally used in practice.
Plasma ionization sources
Duoplasmatrons are also commonly used to produce beams of gaseous ions for MS, in particular oxygen species O- and O2+. In the duoplasmatron, a cathode filament emits electrons into which pure oxygen is bled to a pressure of ~10-5 torr. The gas becomes ionized by interactions with electrons and gas molecules within the chamber, forming a plasma (Figure 7). The plasma is then accelerated through a series of at least two highly charged grids, leading to a primary beam of oxygen ions. However, many different oxygen ion species will be present, so this type of source typically uses a Wien filter to produce a pure beam of O- and O2+.

Figure 7: Schematic diagram of a duoplasmatron. Credit: Evan Mason, reproduced under the Creative Commons Attribution-Share Alike 4.0 International license.
Liquid metal ion sources (LMIS)
Ion beams produced by LMIS are characterized by the smallest spot sizes and highest brightness. They are particularly advantageous in MS imaging where high spatial resolution is required – the spot size of the beams can go down to 5 nm which would equate closely to the spatial resolution in a scanning ion mass spectrometer. A requirement for these sources is a low melting point metal, and Ga is by far the most commonly used. The source itself looks very much like a tungsten filament for an electron microscope but contains an additional reservoir of Ga. When heated, the Ga will flow down the surface of the filament to the tip where the high electric field resulting from the high applied extraction voltages and the small tip radius of the filament lead to field ionization of the Ga from a very small point source (the tip).
Ion sources - spray methods
Electrospray ionization (ESI)
ESI is another soft ionization technique suitable for analysis of large molecules and macromolecules.14,15 The sample is delivered into a capillary held at high voltage (a few kV). This produces a mist of charged droplets of the same polarity. By using a drying gas or elevated temperatures, the charged droplets move through the source and are gradually reduced in size through evaporation of the solvent, leading to an increased surface charge density. At a certain point, the electric field strength within the droplet will be large enough for ions at the surface of the droplet to eject into the gaseous phase (see Figure 8).

Figure 8: Schematic of ESI source and depiction of ionization mechanism.
Desorption electrospray ionization (DESI)
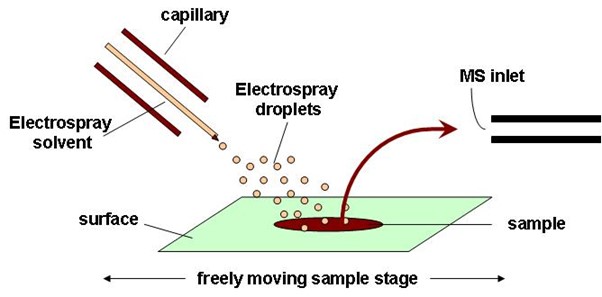
As the name might suggest, DESI is very similar to ESI except now the charged droplets initially formed in the ESI source are used as the source and directed to a sample held at ambient pressure (which is rather similar to DART). The reflected or “splashed” droplets from the sample carry desorbed and ionized analytes that can be subsequently directed into a mass spectrometer (Figure 9). The ionization mechanisms can be complex.16

Figure 9: Schematic diagram of the DESI ion source. Credit: Anzhela016, reproduced under the Creative Commons Attribution-Share Alike 3.0 Unported license.
You can read more about the next steps in the MS process by following the links below to articles on mass analyzers and ion detectors.
References
1. SIUZDAK G. An introduction to mass spectrometry ionization: An excerpt from The Expanding Role of Mass Spectrometry in Biotechnology, 2nd ed.; MCC Press: San Diego, 2005. J Assoc Lab Autom. 2004;9(2):50-63. doi:10.1016/j.jala.2004.01.004
2. Dempster AJ. A new Method of Positive Ray Analysis. Phys Rev. 1918;11(4):316-325. doi:10.1103/PhysRev.11.316
3. Watson JT. Electron Ionization Mass Spectrometry. In: Encyclopedia of Analytical Chemistry. John Wiley & Sons, Ltd; 2000. doi:10.1002/9780470027318.a6006
4. Munson B. Chemical Ionization Mass Spectrometry: Theory and Applications. In: Encyclopedia of Analytical Chemistry. John Wiley & Sons, Ltd; 2000. doi:10.1002/9780470027318.a6004
5. Cody RB, Laramée JA, Durst HD. Versatile New Ion Source for the Analysis of Materials in Open Air under Ambient Conditions. Anal Chem. 2005;77(8):2297-2302. doi:10.1021/ac050162j
6. Yew JY. Natural Product Discovery by Direct Analysis in Real Time Mass Spectrometry. Mass Spectrom. 2019;8(2):S0081-S0081. doi:10.5702/massspectrometry.S0081
7. Cody RB. Observation of Molecular Ions and Analysis of Nonpolar Compounds with the Direct Analysis in Real Time Ion Source. Anal Chem. 2009;81(3):1101-1107. doi:10.1021/ac8022108
8. Lesiak AD, Musah RA, Cody RB, Domin MA, Dane AJ, Shepard JRE. Direct analysis in real time mass spectrometry (DART-MS) of “bath salt” cathinone drug mixtures. Analyst. 2013;138(12):3424. doi:10.1039/c3an00360d
9. Guo T, Yong W, Jin Y, et al. Applications of DART-MS for food quality and safety assurance in food supply chain. Mass Spectrom Rev. 2017;36(2):161-187. doi:10.1002/mas.21466
10. Karas M, Bachmann D, Hillenkamp F. Influence of the wavelength in high-irradiance ultraviolet laser desorption mass spectrometry of organic molecules. Anal Chem. 1985;57(14):2935-2939. doi:10.1021/ac00291a042
11. Duncan MW, Gibson D, Walsh R, Masood A, Benabdelkamel H. An Overview of Matrix-Assisted Laser Desorption/Ionization (MALDI) Mass Spectrometry and Some of Its Applications. In: Detection of Chemical, Biological, Radiological and Nuclear Agents for the Prevention of Terrorism, NATO Science for Peace and Security Series A: Chemistry and Biology; 2014:69-81. doi:10.1007/978-94-017-9238-7_5
12. Rinehart KL. Fast Atom Bombardment Mass Spectrometry. Science (80- ). 1982;218(4569):254-260. doi:10.1126/science.218.4569.254
13. Barber M, Bordoli RS, Sedgwick RD, Tyler AN. Fast atom bombardment of solids as an ion source in mass spectrometry. Nature. 1981;293(5830):270-275. doi:10.1038/293270a0
14. Ho CS, Lam CWK, Chan MHM, et al. Electrospray ionisation mass spectrometry: principles and clinical applications. Clin Biochem Rev. 2003;24(1):3-12. https://pubmed.ncbi.nlm.nih.gov/18568044
15. Banerjee S, Mazumdar S. Electrospray Ionization Mass Spectrometry: A Technique to Access the Information beyond the Molecular Weight of the Analyte. Int J Anal Chem. 2012;2012:1-40. doi:10.1155/2012/282574
16. Takáts Z, Wiseman JM, Cooks RG. Ambient mass spectrometry using desorption electrospray ionization (DESI): instrumentation, mechanisms and applications in forensics, chemistry, and biology. J Mass Spectrom. 2005;40(10):1261-1275. doi:10.1002/jms.922


