Polyacrylamide Gel Electrophoresis, How It Works, Technique Variants and Its Applications
For protein separation in particular, polyacrylamide gel electrophoresis is often the technique of choice.

Complete the form below to unlock access to ALL audio articles.
Gel electrophoresis is a fundamental technique in laboratories across the biological disciplines, permitting the separation of macromolecules such as DNA, RNA and proteins. Different separation media and mechanisms allow subsets of these molecules to be separated more effectively by exploiting their physical characteristics. For proteins in particular, polyacrylamide gel electrophoresis (PAGE) is often the technique of choice.
Contents
What is polyacrylamide gel electrophoresis and what is protein electrophoresis?
How does polyacrylamide gel electrophoresis (PAGE) work?
What is 2D gel electrophoresis?
Applications of protein electrophoresis
- Protein analysis
- Electrophoretic mobility shift assay
- Western blot
- Extraction for mass spectrometry
- Urine protein electrophoresis and immunofixation electrophoresis
In this article, we will consider how PAGE works, how it can be interpreted and some of its applications.
What is polyacrylamide gel electrophoresis and what is protein electrophoresis?
PAGE is a technique that separates macromolecules such as proteins based on their electrophoretic mobility, that is, the ability of analytes to move towards an electrode of the opposite charge. In PAGE, this is determined by the charge, size (molecular weight) and shape of the molecule. Analytes move through pores formed in polyacrylamide gel. Unlike DNA and RNA, proteins vary in charge according to the amino acids incorporated, which can influence how they run. Amino acid strings may also form secondary structures that impact their apparent size and consequently how they are able to move through the pores. It may therefore sometimes be desirable to denature proteins prior to electrophoresis to linearize them if a more accurate estimate of size is required.
The pores formed in polyacrylamide are smaller than those of agarose, used for agarose gel electrophoresis. This makes it more suitable for the separation of proteins over large polynucleotide DNA or RNA fragments and allows the separation of relatively small proteins. Consequently, when people refer to “protein electrophoresis”, the separation technique they will most often be referring to is PAGE.
SDS PAGE vs native PAGE
PAGE can be run under denaturing or non-denaturing conditions, depending on the purpose of the analysis.
The anionic detergent, sodium dodecyl sulphate (SDS), in combination with heat and sometimes a reducing agent is used to denature proteins prior to electrophoretic separation in a process known as SDS PAGE. The heat disrupts the hydrogen bonds that hold secondary and tertiary structures while a reducing agent, such as β-mercaptoethanol, cleaves disulfide bridges. Proteins are linearized and complex with the SDS so that all have a similar mass-to-charge ratio. This eliminates the influence of structure and charge, and proteins are separated solely on the basis of differences in their molecular weight (Figure 1). This system was developed1 by Ulrich K. Laemmli and is typically used to separate proteins of 5–250 kDa.

Figure 1: Linearization of proteins for SDS PAGE. Disulfide bonds are reduced by β-mercaptoethanol while SDS negates differences in mass-to-charge ratios so that proteins are separated on the basis of molecular weight. Credit: Technology Networks.
In native PAGE,2 these bonds are left intact, preserving the protein’s higher order structure. Consequently, the distribution of proteins through the gel is mainly influenced by the protein’s charge (determined by its amino acid sequence and post-translational modifications) and the pH of the separation rather than its size in kDa. However, it allows researchers to analyze proteins in their natural or “native” state. This may be desirable when analyzing bound proteins or complexes, for example, when it is important their biological activity remains intact. As the aim here is to preserve the natural state of the protein, SDS, reducing agents and heat are not used in sample preparation and lower voltages may also be used for separation.

How does polyacrylamide gel electrophoresis (PAGE) work?
The basic principle of PAGE is to separate analytes by passing them through the pores of a polyacrylamide gel using an electric current. To achieve this, an acrylamide–bisacrylamide mix is polymerized (polyacrylamide) by the addition of ammonium persulfate (APS). The reaction, which is catalyzed by tetramethylethylenediamine (TEMED), forms a net like structure with pores through which analytes can move (Figure 2). The higher the percentage of total acrylamide included in the gel, the smaller the pore size, hence the smaller the proteins that will be able to pass through. The ratio of acrylamide to bisacrylamide will also impact pore size but this is often kept constant. Smaller pore sizes also reduce the speed at which small proteins are able to move through the gel, improving their resolution and preventing them from running off into the buffer rapidly when current is applied.

Figure 2: Polymerization and crosslinking of acrylamide. APS catalyzed by TEMED leads to the polymerization and crosslinking of acrylamide. The total concentration of acrylamide components and ratio of acrylamide to bisacrylamide affects the gel’s pore size and therefore the range of protein sizes that can be resolved. Credit: Technology Networks.
1. Equipment
Irrespective of the type of PAGE gel being run, the equipment set up is the same. However, if you are switching between running SDS PAGE and native PAGE, make sure that all equipment is cleaned thoroughly, or have a separate set for each type, if possible, to avoid cross contamination of denaturing agents into the native analysis. Glass plates, spacers, a comb (used to create the sample wells) and casting frame are required to make the gel. The size of the spacers and comb will depend on the volume and number of samples you wish to run. It is important that the glass plates are cleaned and dried thoroughly prior to assembly to prevent poor quality gels or leaks when the gel is poured. Protein-based residues that are not removed may otherwise mar your gel when it is stained.
To run the gel, an electrophoresis tank, power pack and electrophoresis frame (which carries the current through the gel) will also be required.
2. Buffers
Three categories of buffer are necessary for PAGE:
- Gel casting buffer (used to make the gel)
- Sample buffer
- Running buffer (fills the gel tank where electrophoresis takes place)
Electrophoresis may utilize a continuous or discontinuous buffer system.3 A continuous buffer system has only one buffer used for the sample, gel and gel tank and is rarely used for protein analysis as separations tend to be diffuse and poorly resolved. A discontinuous buffer system, most often used for protein separation, uses different buffers for the gel and running buffer. The gels used also incorporate two layers (stacking and resolving gels) with different pore sizes and different buffer compositions. The discontinuous buffer system tends to produce higher resolution separations.
Tris-based buffers are used for PAGE. Tris-glycine, bis-tris, tris-acetate and tris-tricine, all with added SDS, are used for SDS PAGE, with tris-glycine being the most commonly used. For native PAGE, tris-borate-ethylenediaminetetraacetic acid (TBE) with no SDS included is most frequently used. Differences in pH and ionic strength, in addition to differing gel percentages, contribute to the discontinuity of the buffering.
3. The gel
A protein gel is formed in two sections, the stacking gel and the resolving gel. The role of the stacking gel is to allow sample loading and to guide the samples into the top of the resolving gel, so they all enter at the same time. The proteins within the sample will then be separated so they can be “resolved” in the resolving gel. The optimal gel percentage will depend upon the sizes of the proteins to be separated. The lower the percentage, the larger the proteins that can pass through. A lower percentage gel (often around 4% total acrylamide) is used for the stacking gel irrespective of analyte size as it does not perform the separation. It is normally at a lower pH (around 6.8 compared to 8.8) than the resolving gel and has a different ionic content to help focus the sample analytes into a tight band to enter the resolving gel. The percentage of the resolving gel is varied depending on the size of the proteins you wish to separate, typically falling between 7 and 12%.
Gradient gels may also be created that have a low percentage of polyacrylamide at the top where the sample enters, increasing along the sample’s path so that a broader range of protein sizes can be separated. For SDS PAGE, the buffer used for the gel includes SDS, but for native PAGE this is omitted.
The resolving gel is poured first to a level just below the comb. Following the addition of the polymerizing agents, you need to work fast before the gel starts to set. The gel should be pipetted between the glass plates, avoiding the introduction of bubbles, and a layer of hydrated isopropyl alcohol (IPA) is then poured on top to give a crisp edge. Once the resolving gel is set, pour off the IPA and rinse repeatedly with water. The stacking gel should now be pipetted onto the top and the comb put in place, ensuring that there are no air bubbles. Once set, gels can be used immediately or stored in the fridge in an airtight bag with a little water to avoid dehydration until required. They can be stored successfully for a few days, even as long as a couple of weeks, but the longer they are stored for the more diffusion will occur between the two gel layers and the resultant separation may suffer.
Precast gels can be purchased; however, they are typically more expensive than making your own.
4. Sample preparation
Sample preparation will vary depending on whether you are performing an SDS PAGE or native PAGE experiment.
For SDS PAGE, samples, such as lysed cells, tissues or bacteria are mixed with loading dye that contains a number of important ingredients. A dye, such as bromophenol blue, allows the samples to be seen during loading and running. Glycerol helps to weigh the sample down and prevent it floating out of the well during loading. SDS and β-mercaptoethanol linearize the proteins present and negate differences in charge. The mixture is heated, 100 °C for 3 mins is often sufficient, which also helps to denature the proteins.
For native PAGE, SDS and β-mercaptoethanol are not included in the loading dye and no heating step is performed to maintain the proteins in their native conformation.
Prior to loading the gel, samples are centrifuged (16100 x g for 2 mins should be sufficient) to remove insoluble debris. Only the supernatant should be loaded as particulates can interfere with the running of the samples down the gel.
5. Controls
Size markers are normally incorporated on either end of a sample row to enable size estimates for any bands detected. Reference proteins as well as positive and negative controls should be included where possible to verify observations in unknown samples. Lysate from a strain or cell known to produce the protein of interest or purified target protein may provide a suitable positive control. Whereas a strain or cell line the same as that of the unknown sample but in which the gene encoding the target protein has been removed could provide a suitable negative control. Controls that mimic the unknown samples as closely as possible can be particularly useful when examining samples that aren’t purified proteins as it helps to differentiate background bands from the ones of interest.
6. Running the gel
Part-fill the electrophoresis tank with an appropriate running buffer, often tris-glycine-SDS for SDS PAGE and TBE for native PAGE.
Remove the gel (still between the glass plates) from the casting frame and insert it into the electrophoresis frame. Lower this carefully into the electrophoresis tank and top up with running buffer so that the tops of the wells are submerged. Leave the comb in place until you are ready to run the gel as this helps to maintain the integrity of the wells. After the comb is removed, samples should be loaded with a very fine pipette tip or needle. Be careful not to damage the edge of the wells or overload them otherwise samples may be cross contaminated between the lanes. The loading dye combined with the sample helps to visually guide this process and also pulls the sample mix into the bottom of the wells.
Place the lid on the tank, ensuring that the electrodes are the correct way around (black to black and red to red) and apply current to the setup. The voltage used and run time will vary depending on the percentage resolving gel being used, analyte size and whether an SDS or native analysis is being run. Typically, 200 V for 35 mins is a good starting point for SDS PAGE and 100 V for 40 mins for native PAGE (Figure 3). Prechilling the running buffer for native PAGE can help to prevent the samples from heating up, limiting denaturation and damage.

Figure 3: Sample preparation to protein electrophoresis in PAGE. 1) Samples are prepared for analysis, 2) gels are cast and the equipment prepared, 3) buffer is added to the gel tank and samples/controls are added to the gel, 4) current is applied to the samples to separate the proteins, 5) gels are stained and visualized. Credit: Technology Networks.
7. Staining and visualization
Once the samples have migrated a sufficient distance down the gel, which can be seen by the dye front position, the gel frame is removed from the tank and the gel is carefully removed from the glass plates. The stacking gel has done its job and can be carefully cut off and discarded, leaving just the resolving gel.
The proteins must now be stained which is normally achieved using Coomassie brilliant blue4, 5 an organic dye that complexes with basic amino acids, staining the proteins and fixing them in place. Gels are submerged in a staining solution normally consisting of 20% (v/v) methanol, 10% (v/v) glacial acetic acid and 0.1% (w/v) Coomassie brilliant blue made up with water. Gels are submerged in the stain for approximately 1 h (or until sufficiently stained) with gentle stirring (be careful not to tear the gel). Heating can expedite this process but do not boil the solution. Then, wash off excess stain; you’ll notice that the dye also stains the polyacrylamide gel, albeit to a lesser extent than the proteins. Therefore, the gels must then be destained. As the dye binds more tightly to the proteins than the gel, the dye can be removed from the protein-free parts of the gel using a similar solvent to the stain from which the dye is omitted.
A typical destain uses 50% (v/v) methanol in water with 10% (v/v) acetic acid. Gels can be left overnight in destain with gentle stirring to obtain a clear background with stained protein bands, but as with staining, destaining can be expedited by heating. Gels are then rinsed in water and can be visualized immediately; they can be stored in a little water to prevent dehydration.
Solutions that stain proteins without the need for destaining are available and can be particularly useful if a rapid result is required. However, they are typically more expensive than the standard staining protocol. Other stains, such as silver staining,6 can also be used for specific purposes but Coomassie staining is the most common.
Interpreting protein gels
As PAGE gels are typically stained with Coomassie brilliant blue for detection, they can be visualized and interrogated with the naked eye, unlike agarose DNA gels. Images can be captured with a camera to provide a long-term record. Marker ladders are typically run alongside protein samples to allow their size (normally in kDa) to be estimated (Figure 4). It is important to make a note of which sample is loaded into which lane to enable accurate interpretation of results.
In native PAGE gels, sizes may not be accurate due to secondary structures that affect their passage through the gel. In these cases, reference proteins may be included to give the user an idea of how and where their target may be expected to appear. Native PAGE is also very useful when samples on the same gel are being compared, e.g., with different treatments, conditions or binding partners, to look for differences. The strength of the band can indicate the amount of protein present, the more protein there is, the stronger the band. If too much sample has been loaded, bands may appear as strong dark smears that are hard or impossible to interpret. In these cases, you should consider repeating the analysis with less sample.

Figure 4: SDS PAGE with Taq DNA Polymerase. SDS PAGE is a useful technique to separate proteins according to their electrophoretic mobility. The marker (left hand lane) is the Precision Plus Protein Standard all Blue. This SDS PAGE was performed to determine the molecular weight of Taq DNA Polymerase. Credit: Marta Ferreira, reproduced under the Creative Commons Attribution 2.5 Generic license, Creative Commons Attribution-Share Alike 3.0 Unported license and GNU Free Documentation license.
What is 2D gel electrophoresis?
Sometimes, separation of proteins in a single dimension is not enough to resolve similar species. In cases such as this, separation in two dimensions can add the required resolving power as it is less likely that two molecules will be very similar in two distinct properties. Two-dimensional polyacrylamide gel electrophoresis, or 2D PAGE, was introduced in 1975 concurrently by Joachim Klose7 and Patrick H. O’Farrel.8
In the first dimension, proteins are separated linearly according to their isoelectric point (which relates to their charge and pH). In the second dimension, the molecules are then separated at 90 ° to the first separation according to molecular mass to produce an electropherogram (Figure 5).

Figure 5: Example of 2D PAGE. Horizontal protein separation (X-axis) is according to the isoelectric point, vertical separation (Y-axis) is according to molecular weight. The sample is from cucumber plants populated with a pathogenic fungus. Credit: Courtesy of Michal Sharo, Itayba, reproduced under the Creative Commons Attribution-Share Alike 3.0 Unported license and GNU Free Documentation License.
Applications of protein electrophoresis
PAGE is used across many biological disciplines from molecular biology and forensics to biochemistry and genomics, providing an important analytical and diagnostic tool. Let’s consider some of the techniques in which PAGE is an important component.
Protein analysis
Examining samples directly by PAGE can provide a number of helpful indicators, including:
- if an expected protein is present
- what size (or apparent size) it is
- approximately how much there is
- how pure the protein sample is
- if cleavage (e.g., from a tag) has been successful
- which fraction a protein is present in (e.g., from cell lysate fractions)
- protein solubility
When producing recombinant proteins,9 it is important to be able to check that the protein of interest has not been lost at multiple stages during the purification process and that it appears at the expected size. Depending on the fraction in which it is present, it can also indicate if there may be issues with protein solubility, which may impact its function or binding abilities or preclude its purification in the conditions used. Extraneous bands at the end of the purification process can also indicate the presence of contaminants. Recombinant proteins are key for vaccine and biopharmaceutical development, as well as diagnostic assays and research.
Protein analyses are also important for many disciplines including food and beverage development,10 quality control,11 safety 12,13 and fraud detection14 and the analysis of environmental samples. 15,16 However, as technologies are advancing and becoming more affordable and accessible, some analyses in these areas are being replaced17 by techniques such as mass spectrometry (MS).
Electrophoretic mobility shift assay
Electrophoretic mobility shift assays (EMSAs) are an important experimental tool in identifying nucleic acid–protein complexes. This can help to identify binding sites such as those used by transcription factors.18 While agarose gels are frequently used to achieve this as they permit easier migration of larger DNA–protein complexes, PAGE can offer greater separation resolution and greater stability for some complexes.19
Western blot
Separation of sample proteins is an essential first step to any western blot experiment and PAGE is typically the technique employed to achieve this. While PAGE gels are blotted onto membranes for the blot itself, duplicate PAGE gels may also be stained with Coomassie brilliant blue to serve as loading controls when it comes to interpreting western blot results too. These may be used to diagnose infectious and non-infectious diseases, assess the efficacy of therapeutic interventions, inform fundamental research, check recombinant protein purification20 and provide functional or validative information to omics studies.

Extraction for mass spectrometry
Once separated, the proteins in gel bands may be excised and purified for further analysis. Techniques such as MS can be used to derive in depth information about the proteins in the sample.
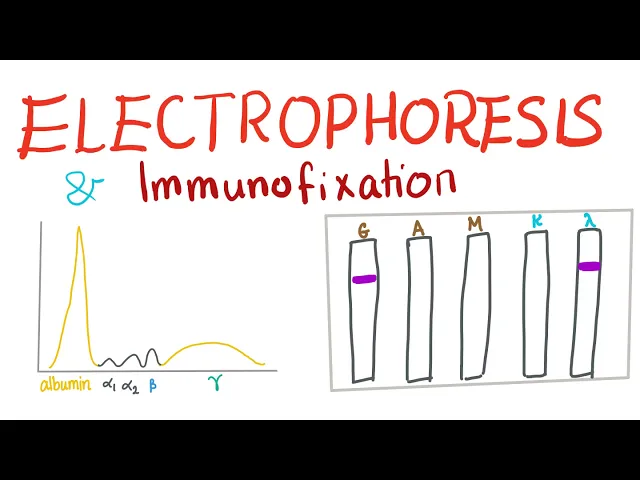
Urine protein electrophoresis and immunofixation electrophoresis
PAGE can provide a useful diagnostic tool to detect the amounts of certain proteins in bodily fluids such as urine or blood. Agarose gel electrophoresis and capillary electrophoresis may be used as alternatives for these analyses too.
Ordinarily, there should be no or very little protein in urine so the urine protein electrophoresis (UPEP) test, which typically measures albumin and globulins, can be used as an indicator of pathological changes. High levels of protein in urine can be an indicator for numerous conditions including inflammation, kidney disease,21,22 infection and some types of cancer (e.g., myeloma)23 and helps to guide further investigation or treatment.
Albumin and immunoglobulins24 can also be analyzed in serum samples (serum protein electrophoresis (SPEP)) to diagnose a range of conditions including cancers such as multiple myeloma,25 lymphoma and leukemia, kidney disease, liver disease, malnutritional conditions, as well as some neurological and autoimmune conditions.
Immunofixation26 can be used in these tests to identify certain subtypes of a protein, e.g., immunoglobulin A (IgA) lambda27 or the heavy and light chain type of the M protein.28,29