IR Spectroscopy and FTIR Spectroscopy: How an FTIR Spectrometer Works and FTIR Analysis
FTIR spectroscopy is one of the most widely practiced analytical techniques in science, but how does it work?

Complete the form below to unlock access to ALL audio articles.
Fourier transform infrared (FTIR) spectroscopy is a hugely popular technique today, due to its unique combination of sensitivity, flexibility, specificity and robustness. Able to cope with solid, liquid and gaseous analytes, it has become one of the most widely practiced analytical instrumental techniques in science. Although there are a number of known limitations to FTIR, such as its relative intolerance of water and its sensitivity to the physical properties of the analysis matrix, it is nevertheless hugely popular, and commonly used right across industries as diverse as food and beverage,1 chemical, engineering, environmental,2 pharmaceutical3 and biomass4 and in clinical settings.5 Suitable instrumentation forms now include both benchtop, handheld and online real-time devices.
What is FTIR spectroscopy and what’s the difference between FTIR vs IR spectroscopy?
How does FTIR work?
FTIR analysis and collecting FTIR data
How to interpret an IR spectrum and an FTIR spectrum
IR spectrum chart
Advantages, disadvantages and uses of mid vs near-IR/FTIR spectroscopy
FTIR applications – present and future
What is IR spectroscopy?
The human eye can only see a small part of the much broader spectrum of electromagnetic radiation (Figure 1). On the high-energy side of the visible spectrum lies the ultraviolet (UV) region, while on the lower energy side is the infrared (IR). IR regions most useful for the analysis of organic compounds tend to be 2,500 to 16,000 nm in wavelength. Far-, mid- and near-IR (NIR) are included under the umbrella of “molecular spectroscopy”.

Figure 1: The electromagnetic spectrum, with inset indicating the sub-region typical for infrared spectroscopy types.
IR spectroscopy is the study of the interaction of IR light with matter, where IR light is characterized by the wavenumber range spanning 12,800 to 10 cm-1. Historically, by convention, IR tends to be described in “wavenumber”, where any wavenumber is inversely proportional to its wavelength. Thus, a shorter wavelength will have a larger wavenumber, referring to the fact that more waves would be able to fit into a given distance. Far-IR is typically defined as radiation between 500 and 20 cm-1, mid-IR between 4,000 and 500 cm-1 and NIR as typically between ~ 10,000 and 4,000 cm-1.

IR light is absorbed by molecules at specific frequencies based on the molecular bonds between atoms and the types of atoms present at the end of the bonds. Photon energies in the IR region induce vibrational excitation of covalently bonded atoms. These covalent bonds are often considered to act like stiff springs that can stretch, bend, rotate and scissor (Figure 2). The higher-energy mid-IR radiation excites fundamental vibrations when energy is absorbed by molecules, raising them from ground state to the first vibrational state. In contrast, NIR spectroscopy is comprised of combination bands of “overtones” produced from those fundamental vibrations. The reader is also directed to useful additional introductory material available from the Royal Society of Chemistry.
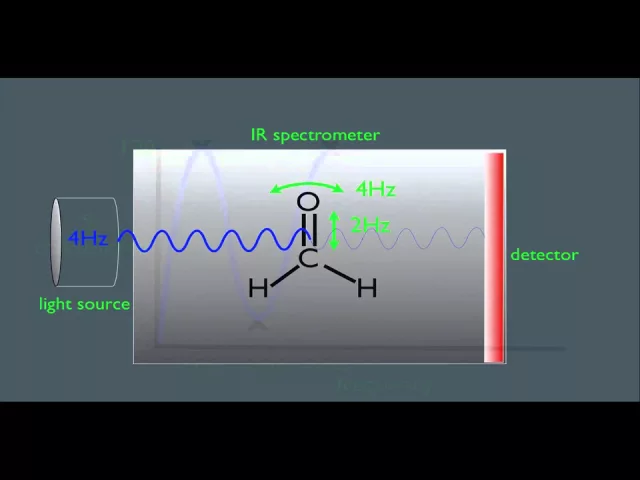
Figure 2: Animation showing the 3-dimensional movements that can occur for molecular atomic bonds when excited by IR light. These movements cause the IR spectral absorbance bands we observe. Credit: Taken from YouTube https://www.youtube.com/watch?v=0S_bt3JI150
What is FTIR spectroscopy and what’s the difference between FTIR vs IR spectroscopy?
The difference between IR and FTIR is that the latter is constructed from an interferogram as the raw signal. This represents the light intensity as a function of the position of a mirror inside the interferometer, not as a function of wavelength (as occurs in dispersive instruments). This is the “FT“. The signal must first be Fourier-transformed (FT) to produce the intensity as a function of wavenumber.
By convention when we speak of FTIR, we think of it as operating in the mid-IR region. However, FT instrumentation is available for both UV and NIR spectral forms. FTIR and FT-NIR are potentially complementary techniques, but usually the analyst must make a choice of which to use for a particular application, so it is worth considering their relative strengths and weaknesses.
The acquisition of FTIR spectra is much faster than by conventional dispersive instruments. The FT method produces spectra that show a much better signal-to-noise ratio and, as the wavelength scale is calibrated with a very precise reference laser, provides higher wavelength accuracy than IR.
How does FTIR work?
Infrared spectrophotometers were developed in the mid-1940s. Initially, their applications were confined mostly to research work on organic compounds, and mainly in the petrochemical field. These first instruments were dispersive scanning spectrophotometers (Figure 3) and slow. Dispersive instruments are still around and have found a new lease of life in novel applications, as they can be more readily miniaturized and manufactured much more cheaply, to produce small, palm-top packages with simple operating systems run on mobiles phones.

Figure 3: Schematic diagram showing the layout of a dispersive IR spectrophotometer.
Today, most research and development grade mid-IR instruments are of the FT type. Their development can be traced back to the 1890s and the work of Albert Michelson, who, while studying the speed of light, invented the “interferometer”, for which he received the Nobel Prize. An FTIR instrument uses an interferometer (Figure 4), which consists of a source, beam splitter, two mirrors, a laser and a detector. The energy goes from the source to the beam splitter which splits the beam into two parts. One part is transmitted to a moving mirror, the other is reflected to a fixed mirror. The moving mirror moves back and forth at a constant velocity, controlled by the calibrating laser’s response. The two beams are reflected from the mirrors and recombined back at the beam splitter, generating an interference pattern, which is transmitted though the sample compartment (and if present the sample where absorbance occurs) to the detector. This signal is then subjected to the FT function to generate a spectrum.
The resulting interference waveform, called an “interferogram”, (discussed later) produced by the FT instrument encodes all the information across all the wavelengths measured. However, to generate an interpretable spectrum, the signal must first be subjected to a computationally intensive Fourier transform mathematical function. In 1966 the development of the Coey-Tukey algorithm6, 7 provided a short-cut calculation, the “fast Fourier transform” or FFT. This, along with the advent of the first commercial computing systems, allowed the launch of the first commercial FTIR, the FTS-14, in 19698 (Figure 5).

Figure 4: Schematic diagram showing the working principle of an interferometer.

Figure 5: Schematic diagram showing the working principle of an FTIR spectrometer. Numbers indicate the steps of FTIR analysis discussed below.
Analysis using an FTIR proceeds as follows.
- The source: IR energy is emitted from a glowing black-body source and the beam passes through an aperture, which controls the amount of energy.
- The interferometer: The IR beam enters the interferometer where “spectral encoding” takes place as already described. The interferometer uses a reference laser for precise wavelength calibration.
- The sample: The IR beam enters the sample compartment where it is transmitted through or reflected off the surface of the sample; specific frequencies of energy that are uniquely characteristic of the sample are absorbed by the sample.
- The detector: The beam finally passes to the detector for final measurement.
- The computer: The signal is digitized, the FFT calculation takes place and final infrared spectrum is presented to the user.
FTIR analysis and collecting FTIR data
There are now a whole range of FTIR instruments and versatile interchangeable accessories that allow gaseous, liquid and solid samples of different sizes and forms to be analyzed by the same basic instrument. It is worth noting that normal glass is not mid-IR transmissible, so all instrument optics and sampling accessories have to be constructed from other suitable IR optical materials. Early techniques developed for solid samples required the analyte to be ground and mixed with IR-transmissible substrates, often potassium bromide (KBr), under high pressure into a small solid clear disk. These were then mounted in a holder for transmission measurements. Liquid (non-water containing) samples were often formed as thin films between two such IR-transmissible discs with a small spacer. Time and reproducibility were both issues with this method.
Over the last 30 years, there has been increasing adoption of alternatives, notably the now ubiquitous techniques of “ATR” (attenuated total reflectance). This device can accommodate small amounts of liquid or solid sample placed onto a crystal window with no real sample preparation required, allowing a spectrum to be gathered in a few seconds. When solids are analyzed, they are firmly pressed onto the crystal window by a top fixing clamp (Figure 6). Most published applications for solid samples now use this form of device. Other types of devices, such as a reflective hemisphere for diffuse reflectance or gas sample sealed cells are also available for specific applications. There are even 96-position microtiter format plates made from gold and other IR-compatible materials, allowing for high-throughput screening using specially adapted FTIR accessory units.9

Figure 6: Use of an ATR sampling accessory.
A typical mode of operation (Figure 7) first requires a background “blank” spectrum to be collected. This will contain absorbance values from the entire light beam path (optics and atmospheric). The sample is then analyzed, and the blank spectrum subtracted from it to yield the spectral responses unique to the sample alone. Both wavenumber resolution (typically 4 to 16 cm-1) and co-added scans (typically 8 to 64) require application-specific optimization to achieve an acceptable balance of signal-to-noise. Individual scans are rapid, typically less than 1 second on modern instruments, so with co-adding scans and background spectral subtraction, analysis workflows for a single sample on an ATR device can be accomplished in less than 2 minutes. This makes FTIR-ATR in particular ideal for measuring 100’s or 1000’s of samples in manufacturing or screening applications, including metabolomic fingerprinting.10

Figure 7: Workflow for producing a typical spectrum.
How to interpret an IR spectrum and an FTIR spectrum
FTIR spectra are information rich, but this very fact can make using and interpreting them challenging. A useful primer for interpreting FTIR can be found here. Even a simple, pure, single compound sample, like vanillin (Figure 8), has a multi-peak spectrum. In such cases, library matching approaches to an authenticated standard may identify it in a single component mixture, but this would be impossible in complex mixtures of other compounds. The problem is that most organics contain combinations of carbon (C), hydrogen (H), nitrogen (N) or oxygen (O) atoms on single or double bonds, and so the same multiple absorption peaks overlap from compound to compound. Simply trying to “eyeball” lots of spectra to try to judge if or how the samples they come from are different in some way then rapidly becomes an overwhelming challenge, even for an experienced analyst. To address this problem, FTIR data is frequently used in combination with statistical modeling approaches, such as multivariate analysis (MVA), which in a chemistry context is commonly termed “chemometrics”.

Figure 8: FTIR spectrum of vanillin, with major peak wavenumbers indicated. Wavenumber (cm-1) is shown on the X axis against absorbance on the Y axis. Credit: Author.
FTIR spectral data is very amenable to MVA techniques, which at their heart simply need multiple spectra to be collected from each sample and constructed into a single data matrix. Here, each table row is an individual sample’s complete spectrum, and each column is the aligned absorbance for particular consecutive wavenumbers across all the samples. In this form, techniques like principal components analysis (PCA) can be applied to explore and visualize possible class-based relationships between different sample group’s spectral responses efficiently via their scores plots. This gives an immediate “interpretability” of sample differences, which is very difficult to gauge from simply over-laying spectra from different sample classes. An example of a PCA scores plot is shown in Figure 9 for raw vs processed bio-oil sample differentiations.
 Figure 9: Bio oil samples showing raw (red) compared to processed (green) material. The FTIR spectrum (left) and the derived PCA scores plot (right) are shown. Credit: Author.
When quantitation is the goal (e.g., concentration values), MVA approaches, such as partial least-squares regression, can be used to build quantitative value-based calibration predictions for properties such as chemical concentrations, using data previously gathered on each sample’s composition from other assay techniques. These known values are then fed into the algorithmic calculation to identify spectral features that best correlate with the external value of interest. This latter approach is very popular as, when properly planned and validated, it can allow FTIR to effectively replace wet chemistry assays for new unknown samples (of the same types), saving time and money. One useful consequence of constructing MVA models is that the statistical output table produced, in addition to the sample plots, allows the most important wavelength used in building the model to be identified. From this information it is often possible to interpret some direct chemical insights.
FTIR is virtually always assumed to be "mid"-FTIR. Non-FT mid-IR dispersive instruments can't produce this broad spectrum as the scan rate is slow and its power (signal-to-noise) is so much poorer. However, NIR has so much more energy that a non-FT dispersive instrument can produce similar spectra to mid-FTIR instruments. But it would take longer and so the resolution (number of actual wavenumbers measured) tends to be lower.
IR spectrum chart
The chart below (Figure 10) shows the bands produced by the major functional groups (1500 cm-1 and above). The region 500-1500 cm-1, which is in the mid-IR region, is called the fingerprint region and provides molecular fingerprints unique to specific compounds that cannot be faked.

Figure 10: Chart showing the IR bands produced by the major functional groups and the fingerprint region specific to each compound.
Advantages, disadvantages and uses of mid vs near-IR/FTIR spectroscopy
The shape and structure of mid-IR vs NIR spectra are quite different, with mid-IR spectra containing sharper and more defined spectral absorption bands (Figure 11) for organic species, which thus lend the technique to structural elucidation and compound identification. Also, detailed data tables of characteristic molecular function group wavenumber regions have been collated and published over the years, many within specific application areas. Organic molecules strongly absorb mid-IR radiation, so good spectra can be obtained from relatively little sample material (e.g., a few powder grains). Disadvantages include its intolerance of water (which quenches the IR signal even when present at just a few percent). In addition, the very fact that organics generally absorb mid-IR so well means that the resulting spectrum will only be from a few microns of sample penetration and represent limited homogeny. Therefore, considerably more careful sample preparation or analytical replication is needed.
NIR’s advantages include a strong response to both chemical and physical attributes of the sample (e.g., making it useful for overall sample grading applications). NIR radiation achieves much more sample penetration, as it is only weakly absorbed, so increased sampling volume may increase sensitivity, gain better homogeny and require far less sample preparation for a measurement to be performed. The major disadvantages of NIR are associated with chemical specificity. Most NIR molecular responses are first order (or higher) overtones, which exhibit degrees of signal overlap, potentially limiting discriminatory power. However, what are considered advantage vs disadvantage is entirely application specific, so both mid-IR and NIR instruments are widely used for different applications.
 vs mid-IR (right) spectra.")
Figure 11: Example of typical NIR (left) vs mid-IR (right) spectra. Note that additional spectral features are resolved in mid-IR. Samples were dried mosquitos, aiming to identify vertebrate blood meals in the malaria vector, Anopheles arabiensis. Credit: Reproduced from Mwanga, E.P., Mapua, S.A., Siria, D.J. et al. 2019 under the Creative Commons Attribution 4.0 International License.
FTIR applications – present and future
FTIR sits in quite a unique “sweet spot” in terms of equipment costs, ease of use and the information it can produce. Its flexibility has seen it applied to more areas than there is room to discuss in this article. A range of pharmaceutical and medical applications are becoming increasingly common.11
In addition, a particularly interesting technical development in the last 20 years has been the appearance and evolution of chemical imaging based in FTIR video chips (focal place array, “FPA”) for microscopy use. While FTIR microscopes have been around since the 1970’s in standard format, they just use a single point IR detector, and any imaging can only be achieved by stitching together large numbers of the single spatial measurements. Such images, even of something small like a cut tissue piece of a cm-2, would take hours to collect. Modern mid-infrared imaging chips, such as a typically sized 128 x 128 pixel arrays (but can be higher resolution), have now become standard. A 128x128 array produces 16,000 spatially resolved spectra in one scan. Images can be acquired in under 30-60 second, and have become used widely This makes spatially resolved applications such, forensics, archeological artifacts, physical contaminants such as microplastics, pharmaceutical pressed tablet testing12 and tissue biopsy screening for disease state and diagnostic prediction possible.13, 14 FTIR-FPA can be usefully applied to situations where chemical signals need to interpreted within a broad spatial context.15, 16

1. Rohman A, Ghazali MAB, Windarsih A, et al. Comprehensive review on application of FTIR spectroscopy coupled with chemometrics for authentication analysis of fats and oils in the food products. Molecules. 2020;25(22):5485. doi:10.3390/molecules25225485
2. Freitag S, Thain SC, Squier AH, Hogan EJ, Crittenden PD. Assessing metabolic changes of the reindeer lichen C. portentosa to increasing environmental N inputs using metabolomic fingerprinting and profiling techniques. Comp. Biochem. Physiol. 2009;153(2, Supplement):S57. doi:10.1016/j.cbpa.2009.04.518
3. Lawson G, Ogwu J, Tanna S. Quantitative screening of the pharmaceutical ingredient for the rapid identification of substandard and falsified medicines using reflectance infrared spectroscopy. PLoS One. 2018;13(8):e0202059. doi:10.1371/journal.pone.0202059
4. Allison GG, Thain SC, Morris P, et al. Quantification of hydroxycinnamic acids and lignin in perennial forage and energy grasses by Fourier-transform infrared spectroscopy and partial least squares regression. Bioresour Technol. 2009;100(3):1252-1261. doi:10.1016/j.biortech.2008.07.043
5. Balan V, Mihai CT, Cojocaru FD, et al. Vibrational spectroscopy fingerprinting in medicine: from molecular to clinical practice. Materials. 2019;12(18):E2884. doi:10.3390/ma12182884
6. Cooley JW, Tukey JW. An algorithm for the machine calculation of complex Fourier series. Math. Comput. 1965;19(90):297–301. doi:10.2307/2003354
7. Lewis W, Welch PD. Historical notes on the fast Fourier transform. Proc. IEEE. 1967;55(10):1675-1677.doi:10.1109/TAU.1967.1161903
8. Griffiths PR. The early days of commercial FT-IR spectrometry: A personal perspective. Appl Spectrosc, AS. 2017;71(3):329-340. doi:10.1177/0003702816683529
9. Sasmaz E, Mingle K, Lauterbach J. High-throughput screening using Fourier-transform infrared imaging. Engineering. 2015;1(2):234-242. doi:10.15302/J-ENG-2015040
10. Ribeiro da Cunha B, Fonseca LP, Calado CRC. Metabolic fingerprinting with Fourier-transform infrared (FTIR) spectroscopy: Towards a high-throughput screening assay for antibiotic discovery and mechanism-of-action elucidation. Metabolites. 2020;10(4):145. doi:10.3390/metabo10040145
11. Fahelelbom KM, Saleh A, Al-Tabakha MMA, Ashames AA. Recent applications of quantitative analytical FTIR spectroscopy in pharmaceutical, biomedical, and clinical fields: A brief review. Rev Anal Chem. 2022;41(1):21-33. doi:10.1515/revac-2022-0030
12. Tiernan H, Byrne B, Kazarian SG. ATR-FTIR spectroscopy and spectroscopic imaging for the analysis of biopharmaceuticals. Spectrochim. Acta A Mol. Biomol. Spectrosc. 2020;241:118636. doi:10.1016/j.saa.2020.118636
13. Kümmel T, van Marwick B, Rittel M, et al. Rapid brain structure and tumour margin detection on whole frozen tissue sections by fast multiphotometric mid-infrared scanning. Sci Rep. 2021;11(1):11307. doi:10.1038/s41598-021-90777-4
14. Finlayson D, Rinaldi C, Baker MJ. Is infrared spectroscopy ready for the Clinic? Anal Chem. 2019;91(19):12117-12128. doi:10.1021/acs.analchem.9b02280
15. Badillo-Sanchez D, Chelazzi D, Giorgi R, Cincinelli A, Baglioni P. Understanding the structural degradation of South American historical silk: A focal plane array (FPA) FTIR and multivariate analysis. Sci Rep. 2019;9(1):17239. doi:10.1038/s41598-019-53763-5
16. Scopetani C, Chelazzi D, Cincinelli A, Esterhuizen-Londt M. Assessment of microplastic pollution: occurrence and characterisation in Vesijärvi lake and Pikku Vesijärvi pond, Finland. Environ Monit Assess. 2019;191(11):652. doi:10.1007/s10661-019-7843-z

