VisIt Application Speeds Visualization Workloads and Empowers Global Research

Complete the form below to unlock access to ALL audio articles.
Today, HPC and visualization are capabilities empowering the forefront of science. To extract meaningful insights from the massive workloads used by today’s researchers requires the support of an application built from the ground up to manage vast quantities of experimental data and extreme-scale simulations. When scientists need to perform tasks like comparative analysis, visual debugging, quantitative analysis, and data exploration, they regularly rely on the open VisIt application for help. VisIt derived its name from a shortened version of the phrase “Visualize It.”
As an open source application, VisIt is intended to serve as ready-made infrastructure for both analysis and visualization-based workloads. Developed over several years at Lawrence Livermore National Laboratory (LLNL) on behalf of the Department of Energy’s (DoE) Nuclear Security Agency, the VisIt application started its journey as a tool to handle huge mesh-based data sets. VisIt offers variants ported to support Apple’s Mac OS, Microsoft Windows, Linux, and several other flavors of Unix. VisIt’s support for large data drives thousands of downloads per year from experts around the globe. The flexibility of the code base supports scientific disciplines like molecular modeling, and techniques like volume rendering.
The app is maintained today by several groups working in parallel, managing and extending the original code iteration. Currently, about a dozen developers from Lawrence Livermore, universities and other DoE labs streamline and grow the application’s one and a half million lines of code, not counting another million lines from developers of third-party libraries. Among the libraries used by VisIt are the Visualization ToolKit (VTK) library for data modeling and many visualization algorithms, Qt widget library for user interface capability, and Python as a command line interpreter. To date, the VisIt team has devoted the equivalent of 100 person-years architecting, coding, and porting the application.
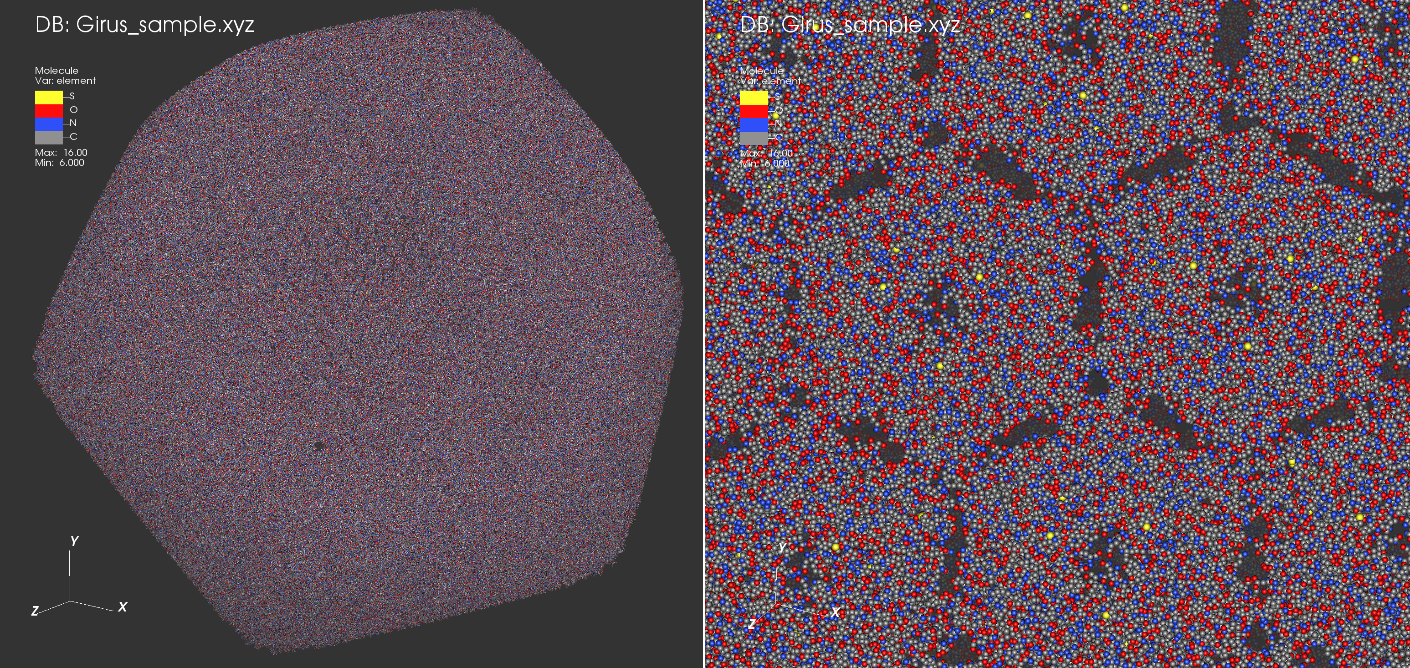
A molecular render of a giant virus (Girus), Cafeteria roenbergensis virus1. The images are rendered with OpenSWR in Mesa 17.1.9 using the VisIt 3.0-beta visualization package. Shown here is a 1.4 GB pseudo-atomic model of the virus outer protein shell (capsid) comprised of 52 million atoms. On the left is an overview of the whole capsid, and on the right is a close-up view with depth and detail of the smaller scale atomic structure. The atoms shown are carbon in gray, nitrogen in blue, oxygen in red, and sulfur in yellow. Image courtesy of Alok Hota, Intel1.
To provide flexibility for user scenarios VisIt’s original design architecture adopts a client-server model. With this approach, the team enabled greater parallelization to process large data sets on the server side, and improve the interactivity of remote data using local workstations. While the client-server model represents the most commonly-used VisIt scenario, with the server reading data files, another option exists. In this second case, a simulation code can directly integrate “Lib-VisIt” which allows it to act as its own server for analysis and visualization. The two-pronged model has accommodated enormous workloads in the past, like particle simulations.
To support a variety of workloads, VisIt offers five main user interface abstractions, with subsets supporting each one. A major contributor to this IPCC VisIt project is Jian Huang, an award-winning professor of computer science at the University of Tennessee, whose team focuses on modernizing the rendering aspects of the codebase using the Intel-driven technology stack for software-defined visualization. Huang elaborates on the various abstraction levels, demonstrating the depth of capability VisIt offers. “VisIt now offers eighty-five file format readers, twenty-one ‘plots’ to render data, and forty-two ‘operators’ to enable manipulation of data. Also, VisIt features fifty pre-determined queries which can pull information from data sets, and more than a hundred ‘expressions’ to create derived quantities. However, our team is always committed to improving the VisIt application. If developers, scientists, and code users tell us they need additional capabilities, we want to do all we can to enable their work.”

Streamlines in isotropic turbulence data rendered with OSPRay 1.5.0 in the VisIt 3.0-beta visualization package. Shown here is a 1.5 GB 512^3 isotropic turbulence volume2 of 3D fluid velocity. 128^2 streamlines were generated through this space using the Runge-Kutta integrator in VisIt. The resulting lines are rendered via OSPRay as geometric cylinder primitives with no need for tessellation.
Hank Childs, an Associate Professor of Computer Science at the University of Oregon, served as the project architect from its inception in 2000 until 2013 and continues work on the project today. According to Childs, the current coding endeavors primarily to expand the app’s scalability further through parallelization for even larger data sets, as well as improvements in areas ranging from user interface to data analysis features. Supplementing these components plug-ins can accommodate additional modules to enable database integration, plotting and more.
Grander scalability sums up the team’s future goals for VisIt. As Childs notes, “VisIt was originally written in an era where each node’s performance restricted to a single core. Compounding the challenge faced by the team, classic disk-based storage has become a bottleneck for large-scale visualization and modeling workloads. The last four to five years represented a fascinating period of much change and much innovation. Modern technologies like Intel Xeon and Intel Xeon Phi processors offer significantly greater multi-core performance. To empower even grander scientific research, we can now update VisIt for greater parallelism to make use of all that processing power. A multi-core solution provides a path forward with the ability to handle data and visualization workloads in-situ. Combined, all this represents a big opportunity for improved scalability -- we live in an exciting time for HPC.”
Supplementing the hardware advancements, the low-level Embree API from Intel offers optimized, public kernels for ray tracing capabilities on the processors. Instruction sets like Intel Advanced Vector Extensions (Intel AVX) create further opportunity for performance enhancement.

A CM1 tornado simulation dataset rendered with OpenSWR in Mesa 17.2.3 using the VisIt 3.0-beta visualization package. Shown here is a 770 MB volume of 3D wind velocity. An iso-surface filter has been applied for 6 velocity magnitudes with a box clip to highlight the internal structure of the tornado. The resulting contour contains approximately 7.7 million triangles. This demo was run using Intel Xeon Platinum CPUs. Image courtesy of Alok Hota, Intel1.
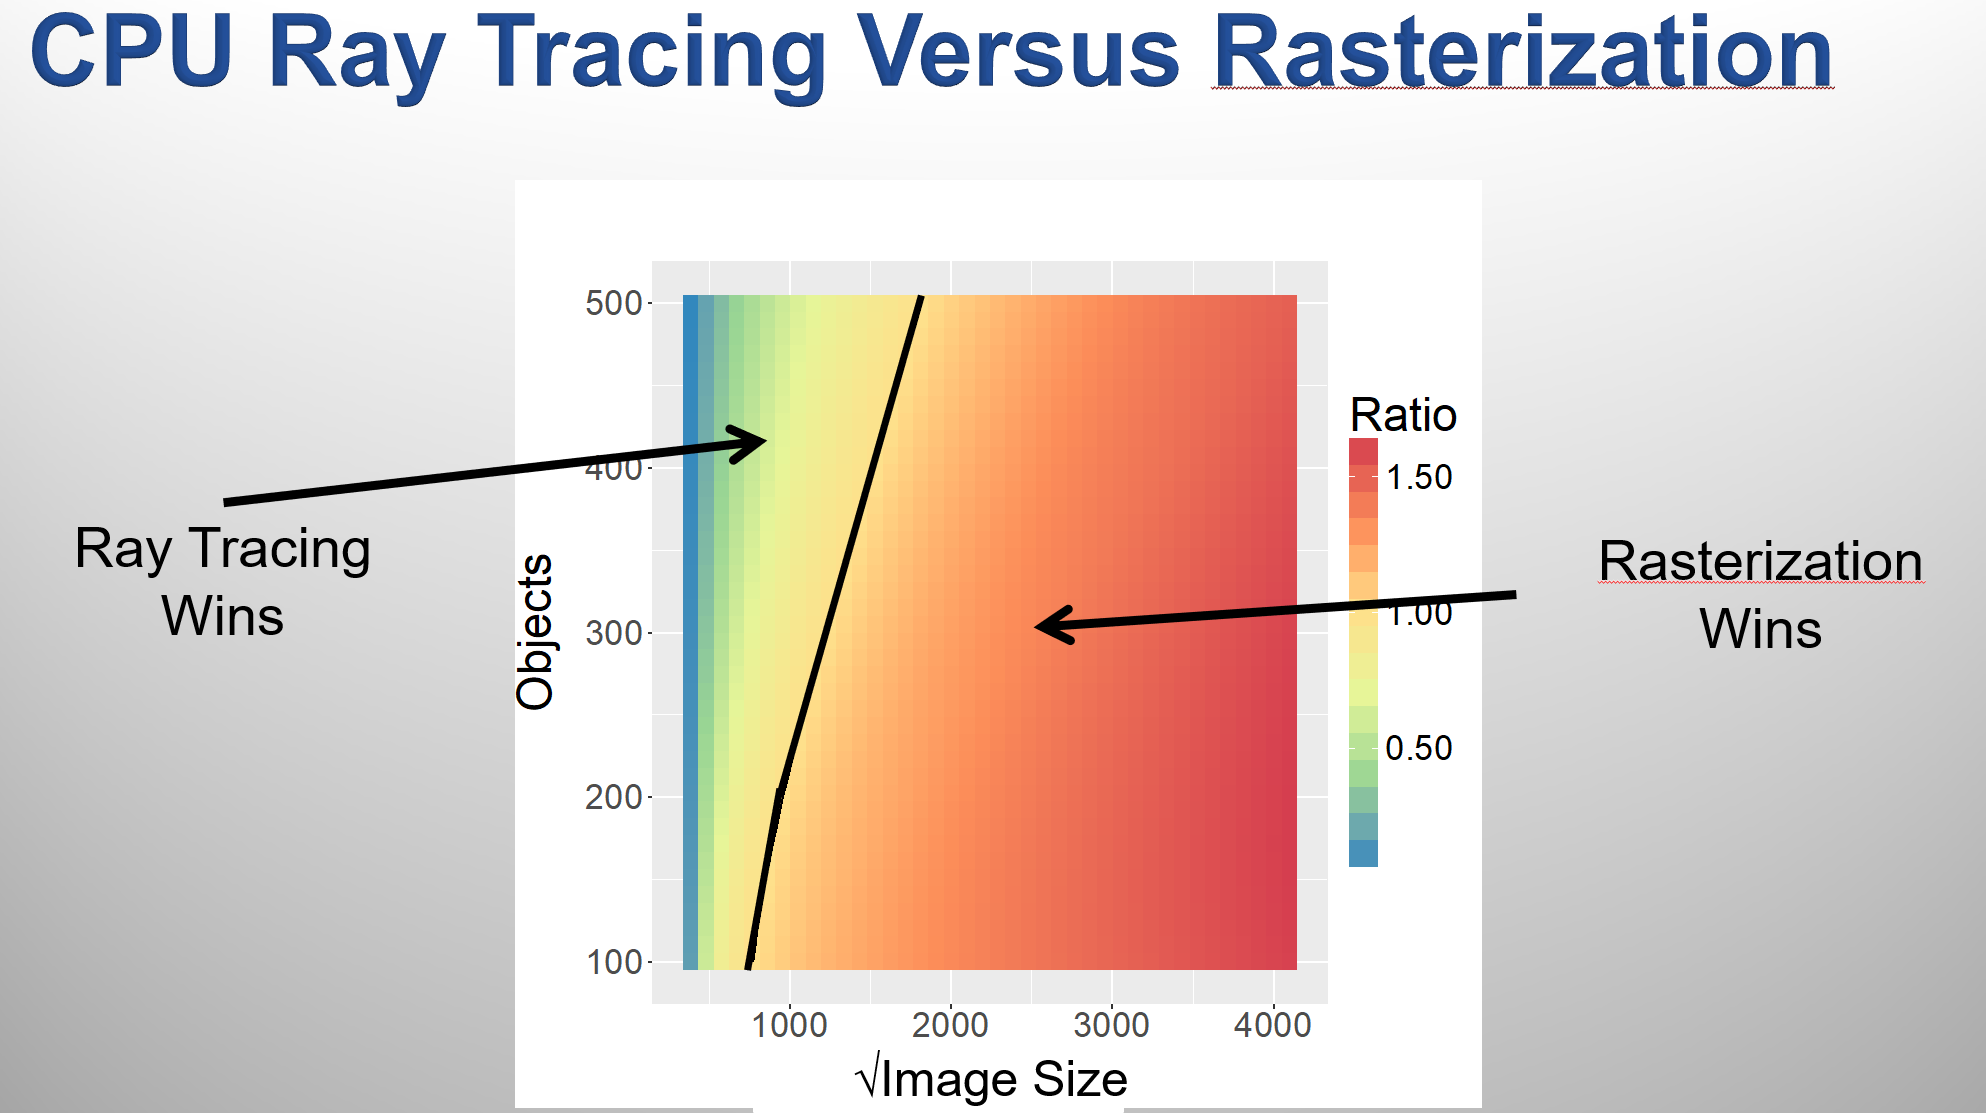
To maximize VisIt’s effectiveness in many scenarios the team has incorporated integration with both OSPRay ray tracing capability for advanced lighting effects in visualization and OpenSWR for traditional rasterization-based rendering. The OpenSWR implementation integrates with Mesa, a software implementation of OpenGL. While OSPRay and OpenSWR adopt differing approaches for visualization, each offers its strengths in the context of VisIt. After performing many tests with varied workload sizes the team finds that OSPRay’s ray tracing methodology provides improved performance in scenarios featuring a large number of objects rendered at a lower resolution. Ray tracing also offers the benefit of advanced lighting effects. On the other hand, OpenSWR’s rasterization prowess excels for scenarios requiring higher resolution visualizations (See Image Above). Since VisIt code can scale to accommodate data sets ranging in size from kilobytes to multi-terabytes, the option of both rendering methods allows for the optimal approach for user needs.
Today, VisIt serves many fields of exploration including astrophysics, and climate-related phenomenon. To demonstrate VisIt’s scalability, Huang and his team have used the newest VisIt codebase with SWR rendering to visualize a terabyte-scale CM1 tornado dataset produced by the research group led by Leigh Orf, an atmospheric scientist at the University of Wisconsin.
Looking to the future of his team’s work, Childs reflects on the efforts and the impacts he hopes VisIt will continue making. “We created VisIt as an enabling technology to help others advance their research. Using it as a tool, scientists can do things which were impossible in the past,” said Childs. “As new processors and other technologies advance HPC, we want to do everything we can to innovate with VisIt and optimize it for the greatest scientific benefit. Over the next decade, we predict a lot more advancement in technology, and our team is excited to learn about new ways researchers can benefit from VisIt.”
1 The figures are based upon a model dataset to test the program visualization capability and are the end result of the VisIt IPCC collaboration including contributions from Chuan Xiao of the University of Texas El Paso, James Jeffers of Intel, Jian Huang of the University of Tennessee, Knoxville, and Hank Childs, Garrett Morrison, and Manish Mathai of the University of Oregon.
2 Y. Li, E. Perlman, M. Wan, Y. Yang, R. Burns, C. Meneveau, R. Burns, S. Chen, A. Szalay & G. Eyink. "A public turbulence database cluster and applications to study Lagrangian evolution of velocity increments in turbulence". Journal of Turbulence 9, No. 31, 2008. Dataset courtesy of the Johns Hopkins Turbulence Database Group.
Rob Johnson spent much of his professional career consulting for a Fortune 25 technology company. Currently, Rob owns Fine Tuning, LLC, a strategic marketing and communications consulting company based in Portland, Oregon. As a technology, audio, and gadget enthusiast his entire life, Rob also writes for TONEAudio Magazine, reviewing high-end home audio equipment.
This article was produced as part of Intel’s HPC editorial program, with the goal of highlighting cutting-edge science, research and innovation driven by the HPC community through advanced technology. The publisher of the content has final editing rights and determines what articles are published.

