A Faster Way to Quantitatively Profile the Lipidome

Complete the form below to unlock access to ALL audio articles.
Introduction
The lipidome refers to the totality of lipids in cells. Lipids are one of the four major molecular components of biological organisms, along with proteins, sugars, and nucleic acids. Comparative studies of the complex lipid mixtures found in cells and tissues could potentially reveal lipid biomarkers since the presence of lipids in membranes, or as signaling molecules, is reflective of the physiological state of an organism at a given time. The lipidome covers a range of lipids from non-polar to polar. Profiling experiments often need two or more chromatography separation schemes to cover the range of polarities: a normal phase method and a reverse phase method. Quantitation of the annotated lipids requires additional investigation using a more targeted approach.
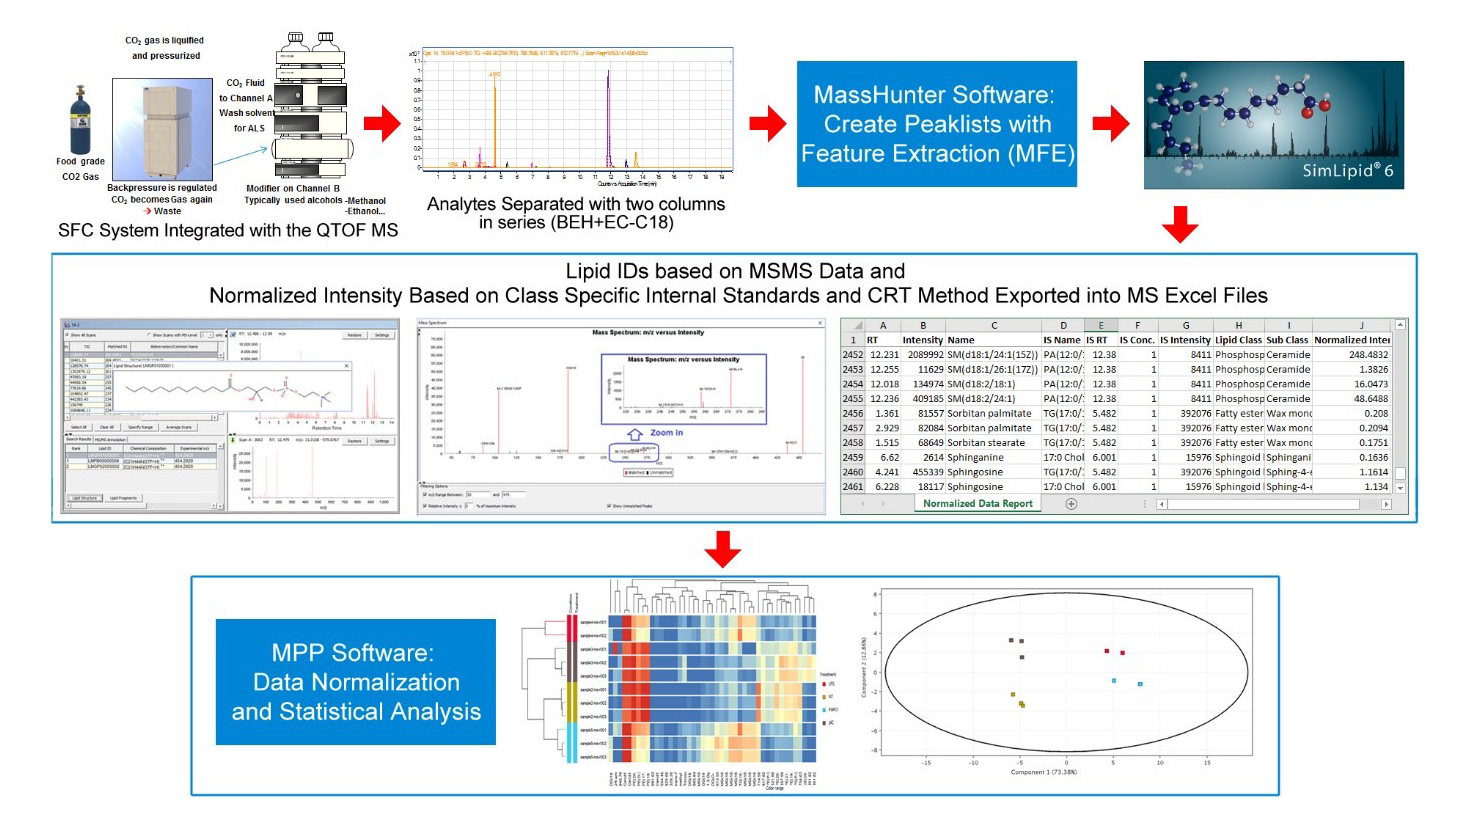
We developed a workflow using Supercritical Fluid Chromatography (SFC) coupled to a high-resolution mass spectrometer for lipid identification and relative quantitation. Unlike the traditional methods, this new method not only effectively separates the nonpolar and polar lipids in a single run but also completed the whole experiment within a short period of time, 15 minutes, that is significantly less than the time for a traditional experiment.
The method is semi-quantitative - multiple internal standards covering the common lipid classes are spiked into the sample. We have developed advanced normalization software tools for the reduction of data variability across samples and batches to improve the performance of multivariate statistical analysis.
Experiment
As a proof of concept of the method, we conducted an experiment and performed detailed analysis described as follows. Mouse macrophage cells extracted by Bligh and Dyer method were analyzed using SFC with EC-C18 and hybrid UPC2 BEH in series coupled with an Agilent 6550 QTOF mass spectrometer. SimLipid software (PREMIER Biosoft, CA, USA) was used for identification, followed by Agilent's Mass Profiler Professional software for statistical analysis.
Results and Discussion
The method separates lipid classes with good chromatographic peak shapes and resolution across lipids within a class. Multivariate analysis performed using the un-normalized raw data showed no grouping of samples based on treatment. This could be because the ionization efficiency of lipids belonging to different classes varies significantly on mass spectrometry experiments with different ion modes.
We investigated two commonly employed methods of peaks normalization by running the experiment with sample spiked with internal standards. These are specific lipid species that are unlikely to be present in the sample added in known concentrations to facilitate quantitative determination of the lipid species present in the sample. We used internal standards belonging to the common lipid classes – namely, glycerophosphoserine, glycerophosphoglycerol, glycerophosphoethanolamine, triacylglycerols, diacylglycerols, monoacylglycerols, cholesterol, sphingomyelins, etc.
In the first normalization method, peaks were normalized using the criteria of "closest retention time (CRT)": The peaks within a retention time window closest to an internal standard representing a lipid class were normalized to the internal standard response. This method suffered from the possibility that certain lipids might elute close to an internal standard but not belong to that class of the internal standard.
Therefore, the second method, which aimed to improve on the first, prioritized annotating the lipids in the sample using MS/MS data with SimLipid software. The annotated lipids belonging to a certain lipid class were then normalized to the intensity of the internal standard for that lipid class. Unidentified compounds and lipids with no matching internal standard belonging to the same class were normalized using the CRT method. Multivariate analysis was performed on the internal standard normalized data. This time around, compounds that were detected by the differential statistics clearly separated the study groups in the multivariate analysis (PCA, PLS-DA) and in hierarchical clustering analysis performed.
Limitation
The flow injection analysis (FIA) lipidomics method, where the sample is directly subjected to mass spectrometry analysis without prior separation of lipid species using chromatography techniques - is one of the most popular techniques and has no retention times. This means that CRT data normalization method is inapplicable in the FIA-based methods. A solution could be to normalize the peaks based on only class-specific internal standards. However, in practice, often lipids are detected with no matching internal standards belonging to the same classes. Currently, the software currently allows users to manually select a lipid of a class as an internal standard. This may not be an ideal way of data normalization because the selected lipid species may not be consistently detected across biological replicates of the sample.
Conclusion
We have designed an integrated SFC-qTOF MS-based workflow that enables high throughput profiling of complex lipids with a wide range of polarity and concentrations in a single analytical run at a short time period. Subsequent quantitation is then achieved by performing peak normalization using internal standards and multivariate statistical analysis. Future work would look to improve the software so that lipids with no matching internal standards can be normalized automatically with respect to either “average of all internal standards response" or "sum response of all the lipids detected for the class". This will make the data normalization method applicable to all mass spectrometry-based lipidomics methods that use either chromatography separation or FIA approaches.
Acknowledgement: The method was developed by a collaborative team
Sheher Bano Mohsin1; Kevin Williams2; Durairaj Renu3; Ningombam Sanjib Meitei4,6; Shyam
Kalakoti3; Stephen Madden5 and Norton Kitagawa5
1Agilent Technologies Inc., Wood Dale, IL; 2UCLA, Los Angeles, California; 3Strand Life Sciences, Bengaluru, Karnataka; 4PREMIER Biosoft, Indore, M.P.; 5Agilent Technologies Inc., Santa Clara, California, 6PREMIER Biosoft, Palo Alto, CA, US.

