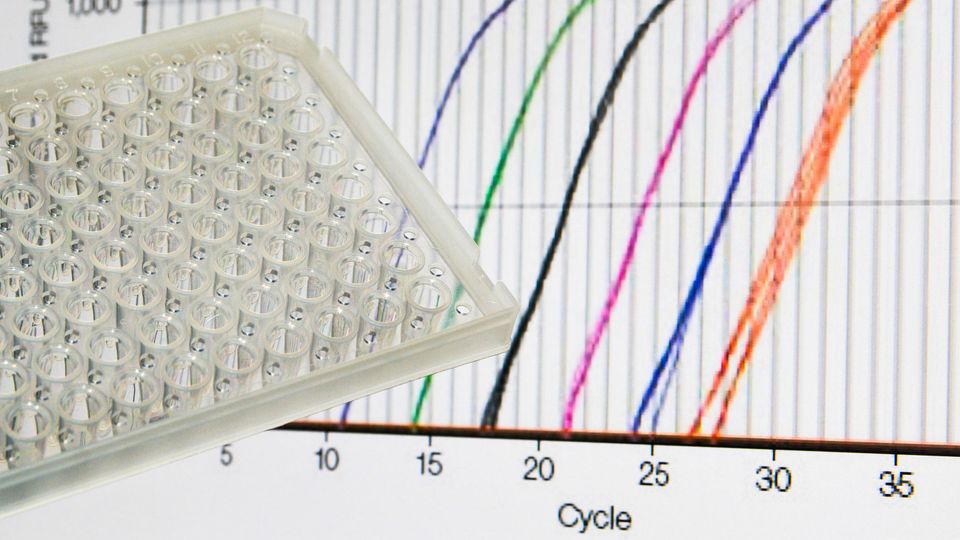
Quantitative polymerase chain reaction (qPCR) remains one of the most widely used techniques for nucleic acid quantification, but generating accurate, reproducible results depends on careful assay design and optimization.
From selecting appropriate controls and detection chemistries to designing primers and probes, numerous factors can influence assay performance.
This guide explores the key considerations for developing robust qPCR assays, covering everything from experimental setup to data interpretation.
Download this guide to learn:
- How to optimize controls, primers, probes, and detection strategies for reliable qPCR performance
- Best practices for generating standard curves, evaluating amplification efficiency, and interpreting qPCR data
- Practical approaches to minimizing contamination, improving reproducibility, and strengthening assay design
1
Essential Tips for Designing and
Optimizing qPCR Assays
Divenita Govender
Quantitative polymerase chain reaction (qPCR) is a PCR-based technique that quantifies nucleic acids in a
sample in real time. The assay combines nucleic acid amplification with fluorescent reporter molecules to
measure the amount of PCR product generated over time. As the amount of amplified product increases,
the fluorescence intensity also increases with each cycle. This increase is proportional to the amount of
PCR product generated.
qPCR is a powerful assay; however, several parameters need to be optimized to ensure a successful and
efficient run. This guide explores key considerations for experimental design and provides tips and tricks
to improve your qPCR assays.
Selecting appropriate controls
Both absolute and relative quantification methods require a no-template control (NTC) as well as a positive
and negative control for each run. The NTC is used to determine whether any contamination has been
introduced during plate setup.
You can obtain more information from your positive control if it is derived from a different source and
contains the gene of interest, ensuring your primers are working as expected. You can also spike positive
controls into the sample to test for inhibitors. This helps ensure that the entire qPCR reaction is performing
as expected.
The negative controls can include a no-amplification control (NAC) and a no-probe control (NPC). NACs
contain all components except the DNA polymerase. This ensures that any fluorescence detected is the
result of amplification and not probe degradation. NPCs determine whether any background signal is
present and can also indicate contamination.
Top tip: If amplification is detected in your NTC, it indicates contamination, most commonly from
DNA or previously amplified PCR products. To minimize the risk of contamination, prepare the
master mix and reaction plate in a dedicated clean area and add the DNA or cDNA template in a
separate area. If possible, use separate pipettes and consumables for reagent preparation and
template addition.
How To Guide
ESSENTIAL TIPS FOR DESIGNING AND OPTIMIZING QPCR ASSAYS 2
Choosing a method of detection
Your choice of reporter molecule is dependent on the type of instrument you have. There are two types
of reporter molecules: fluorescent probes and intercalating dyes. Intercalating dyes are non-specific and
more cost-effective. Fluorescent probes use a fluorescent reporter dye and a quencher. The reporter and
quencher only produce a fluorescent signal when the probe binds to the target sequence and is cleaved
during amplification. This approach is best suited for multiplexing because it provides higher specificity
and ensures the fluorophores have minimal overlap and no crosstalk between targets.
Generating a standard curve
If absolute quantification is required, a standard curve must be generated, and these samples must be included
in the experimental setup. Using a template with a known starting concentration, a serial dilution is
prepared and added to the plate alongside the unknown samples. After qPCR is completed, the log of the
initial template copy number is plotted against the Cq values for the dilution series. The standard curve
is created by fitting a linear regression line to these data points. The Cq values of unknown samples can
then be used to extrapolate the initial copy number from the standard curve.
The standard samples should be run in duplicate or triplicate and should cover the concentration range
expected in the assay. Copy number cannot be extrapolated if the Cq value is outside the range of the
standard curve. Most importantly, the primer set must work for both the experimental samples and the
template used to generate the standard curve.
Optimizing primers and probes
Primer and probe design will make or break your qPCR. If predesigned primers and probes are not
available, various websites and software programs from both commercial companies and independent
sources can assist with their design.
The general guidelines for primer design include:
• An amplicon size of 80–150 bp for DNA-binding chemistries and 60–90 bp for probe-based detection.
• A primer length of 18–30 bp.
• A melting temperature (Tm) within 2 °C of each other (between 54 °C and 65 °C).
• A GC content between 40% and 60%, ideally.
• A 3′ G/C terminal base is suggested to promote binding stability; however, more than four consecutive
identical nucleotides should be avoided.
• A 3′ T terminal base should also be avoided, as thymine tends to misprime.
For probes, the guidelines are slightly different:
• The probe should bind within the amplified region between the forward and reverse primers, without
overlapping either primer.
• The probe length should be between 18–30 bp.
How To Guide
ESSENTIAL TIPS FOR DESIGNING AND OPTIMIZING QPCR ASSAYS 3
• The Tm should be 8–10 °C higher than the Tm of the primers. This ensures that the probe binds to the
target sequence.
• A GC content of 30%–80%.
• Avoid a terminal 3′ G residue, as the 5′ G acts as a quencher to the 5′ fluorescent molecule.
Both primers and probes should be designed to have high specificity and low self-complementarity. Test
a range of primer and probe concentrations systematically to determine the ideal combination. Primer
concentrations can range between 50–300 nM when using intercalating dyes and 300–900 nM for probebased
chemistries. Probe concentrations range from 50–250 nM. The optimal annealing temperature of
the primers should be determined using a gradient PCR with an intercalating dye or gel electrophoresis.
When designing a fluorescent probe, the fluorophore and quencher need to be compatible. This is particularly
important when targets are multiplexed.
The master mix you choose depends on the detection chemistry being used. Commercial master mixes
are generally recommended, and their components should only be optimized if necessary. Preparing a
single master mix for all reactions minimizes pipetting variation and improves reproducibility.
Top tip: The standard curve can be run to test the amplification efficiency of new primers and
probes before the actual experiment.
Multiplexing
Multiplexing samples is a great alternative for reducing costs and conserving reagents. However, it should
be avoided if the expression or detection levels vary significantly. While multiplexing can save time, if
there are several targets in a sample, it may be more time-consuming to optimize a multiplex assay than
to run the targets individually. It is advised to use multiplex qPCR when the PCR efficiencies for each target
are comparable and when testing is performed routinely.
RT-qPCR for gene expression analysis
RT-qPCR is primarily used for gene expression analysis. RNA serves as the starting material, and reverse
transcription (RT) is performed before qPCR to generate complementary DNA (cDNA). This can be carried
out as either a one-step reaction, in which reverse transcription and qPCR occur in the same tube, or a
two-step reaction, in which cDNA is synthesized first and then used as the template for qPCR.
When setting up the reaction, keep all reagents on ice to prevent the reaction from starting prematurely. A
no-reverse-transcriptase (no-RT) control is suggested to ensure that there is no contaminating DNA in the
sample, as DNA polymerase is unable to amplify RNA.
When performing expression analysis, the ΔΔCq method is widely used. This eliminates the need for a
standard curve as expression is calculated relative to a control group. The control group is typically a
wild-type or untreated sample. In addition, the expression data must be normalized to a reference gene
per sample. The reference gene is chosen as a target that is constantly expressed at the same level
throughout the experiment and between all samples in the assay.
How To Guide
ESSENTIAL TIPS FOR DESIGNING AND OPTIMIZING QPCR ASSAYS 4
To calculate the fold change of expression:
ΔΔCq = (Cqtarget – Cqreference gene) sample – (Cqtarget – Cqreference gene) control group
Fold change = 2-(ΔΔCq)
Top tip: Design your primers to span an exon–exon junction whenever possible. This ensures
that the assay amplifies the transcript rather than contaminating genomic DNA. If it’s not possible,
treat the RNA sample with DNase before reverse transcription to remove any contaminating
genomic DNA.
Data analysis and interpretation
Two analyses have already been discussed: absolute quantification using the standard curve and relative
quantification using the ΔΔ Cq method. The reaction efficiency can be calculated using the slope of the
standard curve:
Efficiency = 10(-1/slope) –1
If the slope is −3.32, then the PCR is 100% efficient. Ideally, the PCR efficiency should be between 90% and
110%. Efficiencies below 90% may indicate poor amplification, while efficiencies above 110% may suggest
non-specific amplification, primer-dimer formation, or inaccurate pipetting. The R² value of the standard
curve indicates the accuracy of the standard curve itself. Changes in the R² value may indicate pipetting
errors, inconsistent standard dilutions, poor primer performance, or other experimental issues, and the
assay should be repeated if significant.
Understanding Cq values provides information about the amount of starting template in the reaction.
Lower Cq values indicate a higher initial amount of target nucleic acid, whereas higher Cq values indicate
a lower initial amount.
The melt curve generated after the run is important for determining whether you have a single amplified
product. A single, well-defined melt peak is generally consistent with amplification of a single product. If
multiple peaks are observed, they may indicate primer-dimers (low-temperature peaks) or non-specific
amplification. This is especially helpful when using intercalating dyes as a detection method, as they are
non-specific and bind to any double-stranded DNA. Other important values are the baseline and threshold
values. The baseline is the background signal at the beginning of the run, where there is no detectable
increase in fluorescence. The threshold is the level of fluorescence above the baseline at which the signal
is detected and is no longer considered background.
A successful qPCR experiment relies on optimized reaction conditions, well-thought-out experimental design
with appropriate controls, and accurate interpretation of the results. Taking the time to consider and
implement these factors can improve the reliability and reproducibility of your qPCR experiments.
About the author:
Divenita Govender is a microbiologist with an MSc in Microbiology and research experience in molecular microbiology and infectious
diseases. Her MSc research investigated small RNAs in clinical strains of Mycobacterium tuberculosis, using molecular
techniques including RT-qPCR. She has since worked in diagnostic and research laboratory settings in South Africa and worked as
a technical specialist in the Parasites and Microbes Programme at the Wellcome Sanger Institute.
How To Guide